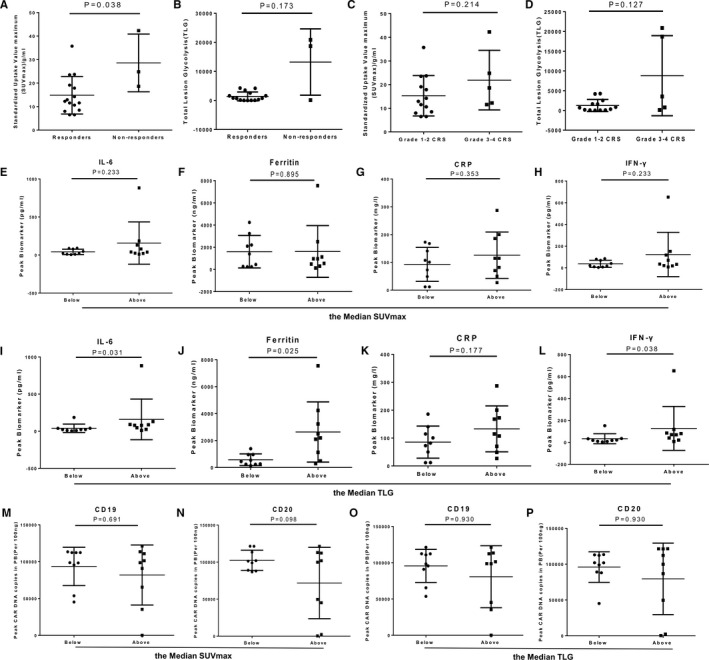
FIGURE 5.

The values of SUVmax and TLG in response, CRS and CAR‐T cells expansion. (A, B) The vaule of SUVmax and TLG in the groups with and without response. (C, D) The vaule of SUVmax and TLG in grade 1‐2 and grade 3‐4 CRS. (E‐H) Peak CAR DNA copies of anti‐CD19 and anti‐CD20 in below and above the median SUVmax/TLG groups. (I‐P) The peak value of serum biomarkers (IL‐6, IFN‐γ, ferritin, and CRP) in below and above the median SUVmax/TLG groups. The peak value is defined as the maximum level of the cytokine after baseline within a month. The data represent the means ± SD. The Mann‐Whitney U test or t test were used for statistical analysis
