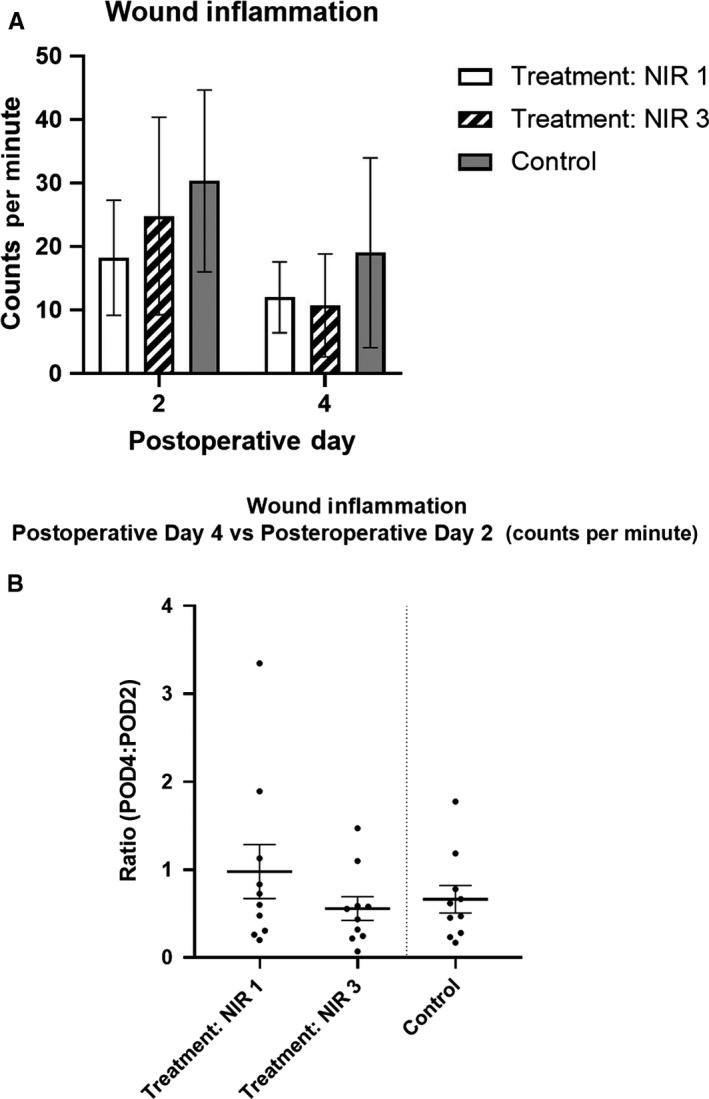
FIGURE 2.

Inflammation at the wound. A, Mean wound inflammation was not significantly different between experimental groups (P > .05 for both POD 2 and 4; one‐way ANOVA). B, Ratio of POD4 to POD2 inflammation was not significantly different between treatment groups (P = .37; one‐way ANOVA). Error bars represent SEMs. Treatment NIR 1 and 3 = surgery performed day one and three post‐NIR‐PIT, respectively. Inflammation measured via photon imaging of reactive oxygen species 50 min after intraperitoneal administration of 0.5 g 20 g−1 dose of L‐012. POD, postoperative date
