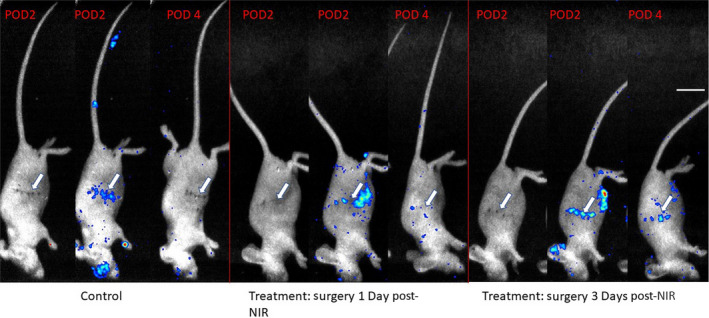
FIGURE 3.

Singlet oxygen production at the wound. Representative mouse from each group, shown at Postoperative Day 2 (POD2) with white light images (to visualize the wound), Postoperative Day 2 with ROS signal included, and Postoperative Day 4 (POD4) with ROS signal included, respectively. Signal represents counts. Counts decrease significantly between POD 2 and POD 4. Reactive Oxygen Species elicited via intraperitoneal injection of L‐012 (0.5 mg 20 g−1) 50 min prior to imaging. Imaging window = 0.05‐0.50 × 10⁻³ counts for images in which ROS signal is included. In some mice, there is observable inflammation near the eyes (post‐operative inflammation secondary to Elizabethan collar usage, preventing self‐grooming), ears (location of hole‐punching for identification), and site of peritoneal injections. Arrows indicate where the tumors were located. Scale bar represents 1 cm
