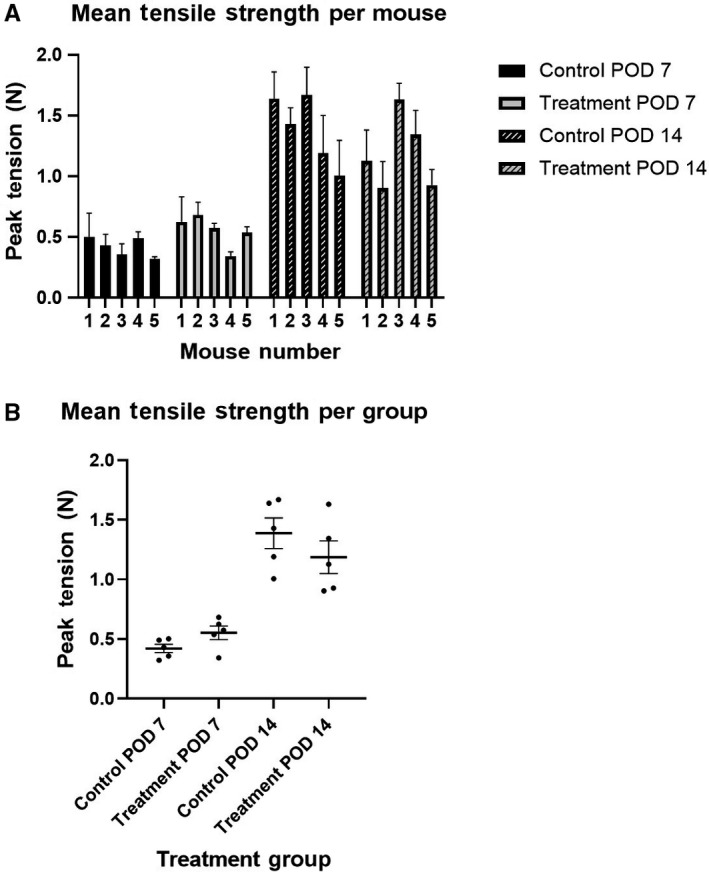
FIGURE 4.

Wound tensile strength. A, Mean wound tension was not significantly different between mice in a given group (P > .05 for each group using one‐way ANOVA). B, Mean tension in control group vs treatment groups showed nonsignificant differences at their respective timepoints (mean tension POD 7: control = 0.42, treatment = 0.55, P = .096. POD 14: control = 1.39, Treatment = 1.19, P = .314; unpaired t test with Welch's correction). POD 7 and 14 = wound tension measured on Postoperative Days 7 and 14, respectively. N = 5 mice per group. N = 3 measurements per mouse, using three 2‐mm‐wide segments of skin tissue included wound. Tension applied orthogonal to direction of incision and suture. Error bars represent SEMs
