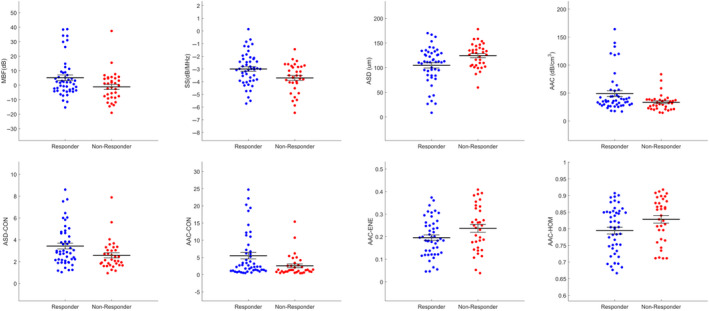
FIGURE 2.

Scatter plots of four spectral and four texture parameter values for responders and nonresponders that were found to have a statistically significant difference from one another (P < .05). MBF (dB): mid‐band fit, SS (dB/MHz): spectral slope, ASD (µm): average scatterer diameter, AAC (dB/cm3): average acoustic concentration, ASD‐CON: contrast of the average scatterer diameter, AAC‐HOM: homogeneity of the average acoustic concentration, AAC‐ENE: energy of the average acoustic concentration, AAC‐CON: contrast of the average acoustic concentration
