FIGURE 4.

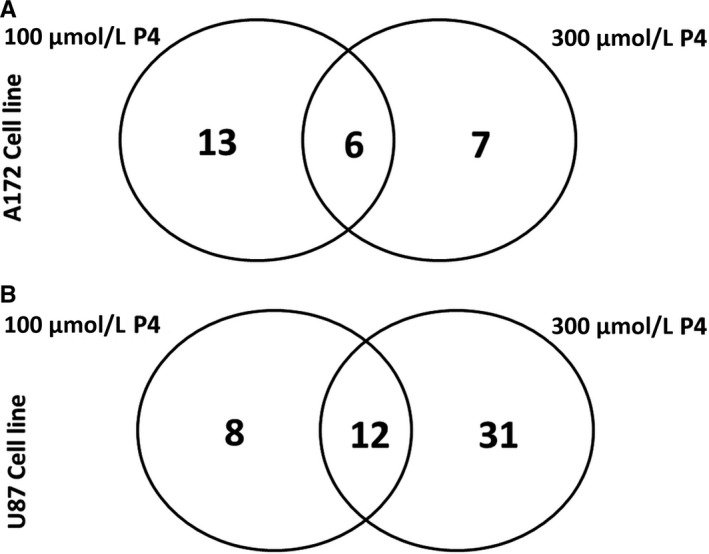
Venn diagram depicting differentially expressed proteins in (A) 172 cell line (B) U87 cell line was identified by mass spectrometry

Venn diagram depicting differentially expressed proteins in (A) 172 cell line (B) U87 cell line was identified by mass spectrometry