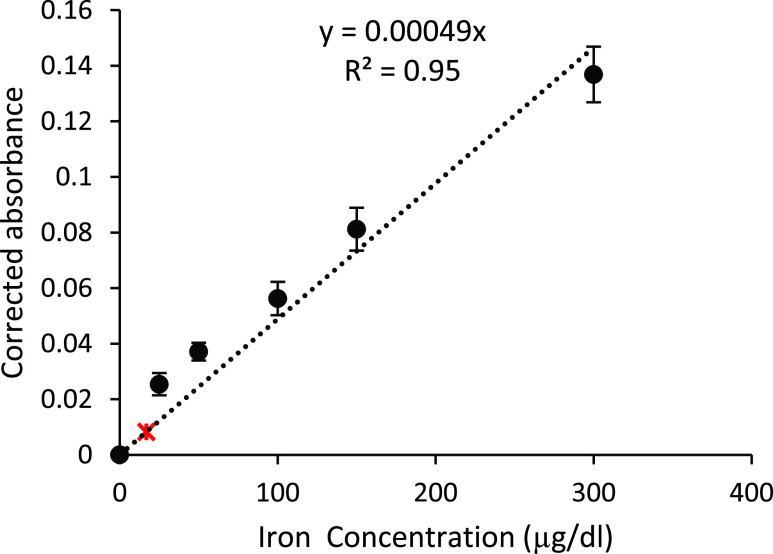
FIGURE 9.
New assay calibration curve from 25– /dL resulted in a slope of 0.00049, comparable to the optimized reference method 0.00093 in Figure 4. Average values are marked with +/−1 standard deviation. The estimated limit of detection was
  /dL, marked with a red asterisk.

