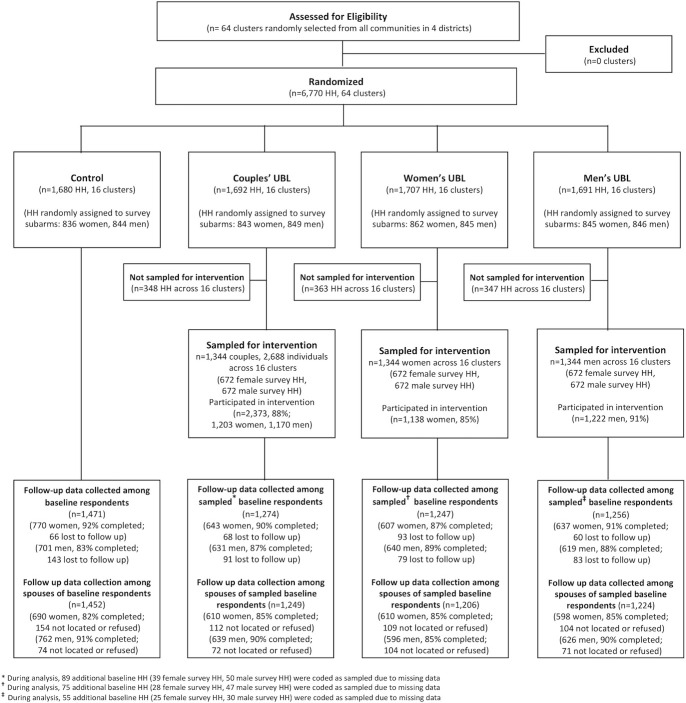
Fig 1. Participant flow diagram.
Note: Records around sampling of households for intervention were missing in some intervention communities due to fieldworker error. Any households for which records were missing were coded as sampled for the intervention in order to generate conservative estimates of intervention effects. HH, household; UBL, Unite for a Better Life.

