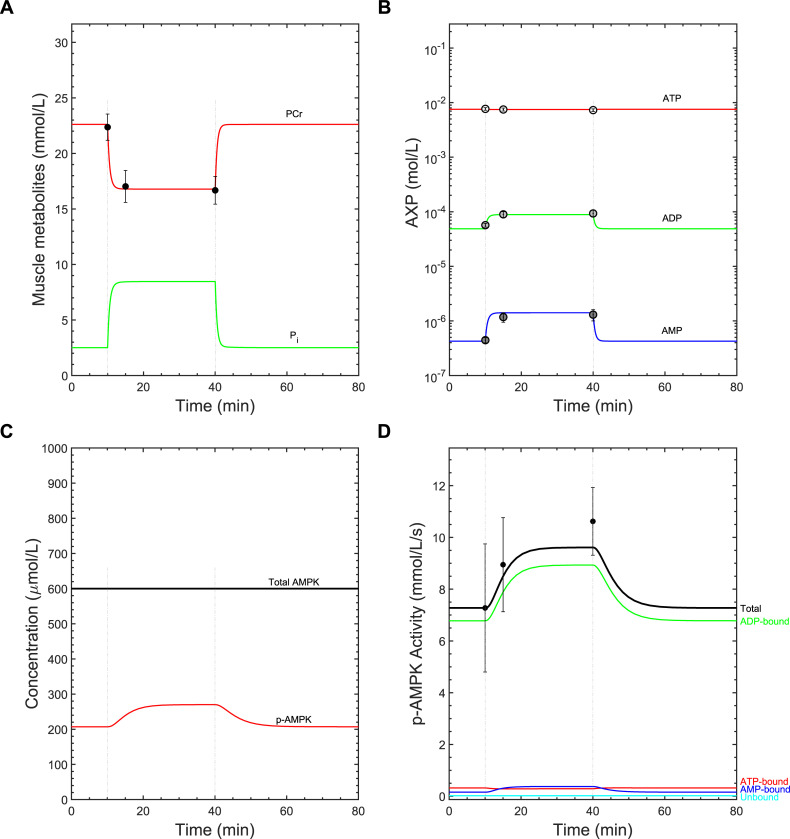
Fig 2. Model calibration results.
The model was initially calibrated to data collected from a 30-min submaximal-intensity cycling exercise protocol [5]. For all panels, the measured data are presented as means ± standard error, if available, and the hatched vertical lines indicate the exercise initiation and cessation times. A) Time courses of phosphocreatine (PCr) and inorganic phosphate (Pi) concentrations. The filled circles represent measured PCr concentrations. B) Semi-logarithmic plot showing the time courses of AXP concentrations in response to exercise. The open points, light gray points, and dark gray points represent the measured ATP, ADP, and AMP concentrations, respectively. C) Time courses of the total and phospho-AMPK (p-AMPK) levels. D) Time courses of the simulated kinase activities of each AXP-bound phospho-AMPK (AXP-p-AMPK) complex. Filled circles represent the measured mean relative change in total AMPK activity between rest and exercise.

