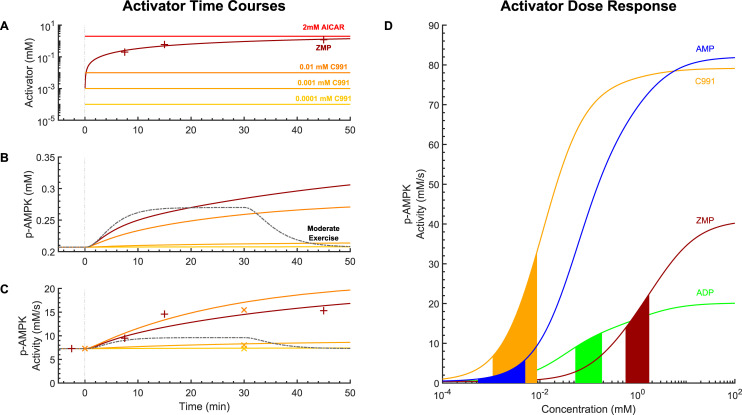
Fig 5. AMPK pharmacological activator analysis.
Time courses and dose response of simulated AICAR perfusion, simulated Compound 991 incubation, and moderate intensity exercise (63% ). A) Time courses of concentrations of activators. To simulate perfusion of AICAR, we assumed that its concentration remained unchanged throughout the simulation. The concentration of ZMP was fitted to published data. B) Time courses of phospho-AMPK (p-AMPK) concentrations for each simulation. C) Total AMPK activities for each simulation. The “×” and the “+” markers denote measured AMPK activities in response to Compound 991 and ZMP, respectively. D) Dose response of AMPK activities in response to treatment with Compound 991, ZMP, ADP, and AMP. The model was simulated independent of the bioenergetic module by removing reactions 1–5 and setting the AXP = 0 except if added exogenously, in which case its total concentration was held constant by setting generation and degradation reaction rates to zero. The reactions were simulated for 240 minutes and the steady-state values plotted. The filled portions under each curve indicate the ranges of activator concentrations that are either measured (AMP, ADP) or experimentally applied (ZMP, Compound 991).

