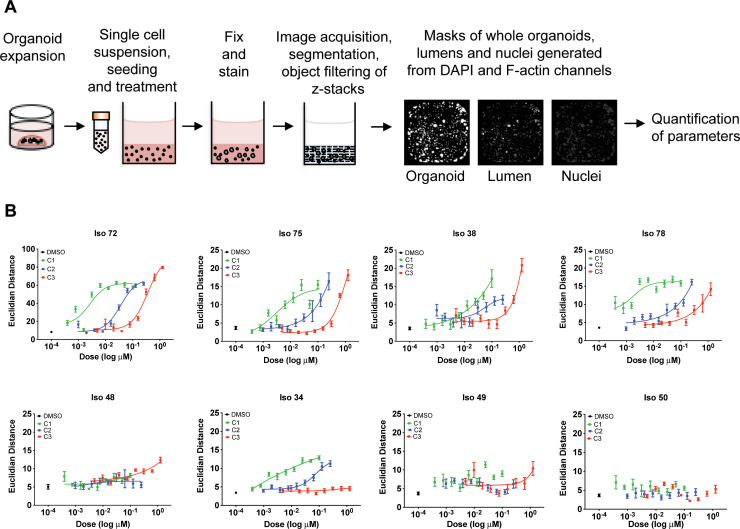
Fig 3. 3D image analysis demonstrates target affinity of tankyrase inhibitors in organoids.
(A) Flow diagram of high-content multi-parametric image screen process. (B) Dose response curves acquired from high content imaging screen. Organoids were seeded as single cells in 384 well plates and exposed to Tankyrase inhibitors C1, C2, C3 for six days. Individual morphological measurements were generated from DAPI and F-actin channels. Principal component analysis was used to select the top 10 most discriminating features to separate compound-induced phenotypes between high and low doses of Tankyrase inhibitors. Selected parameters were used for feature space training, whereby Euclidean distance metrics were calculated between high and low doses of each compound for each organoid line. Euclidean distances were used as an indicator of similarity between low and high doses, with a low distance indicative of high phenotypic similarity between conditions. Data are presented as mean Euclidean distance from 8 replicate wells ± S.D.

