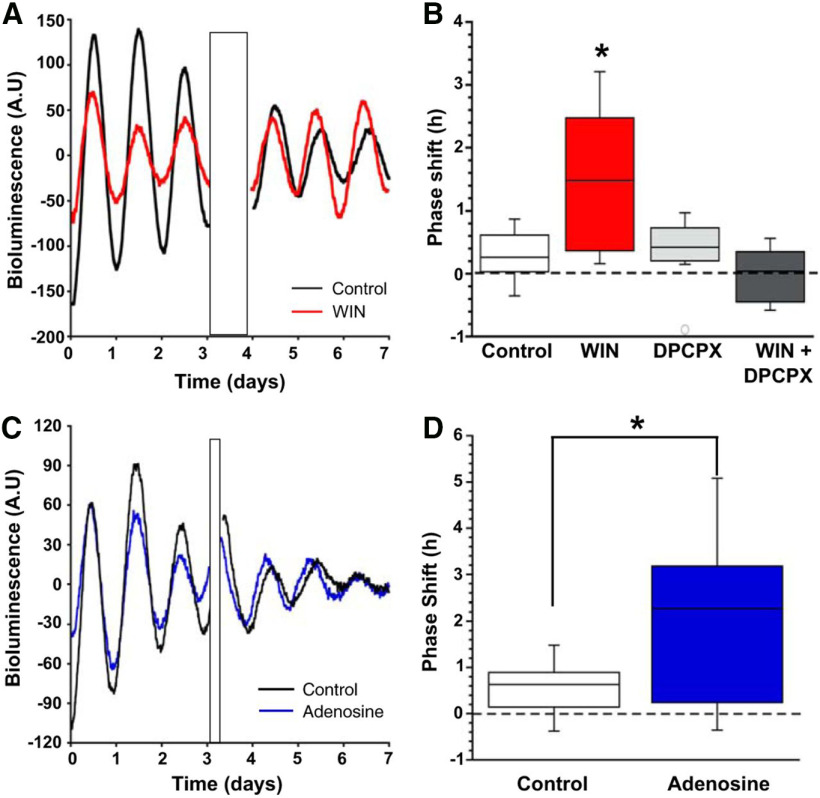
Figure 3.
Daytime application of either WIN or adenosine phase advanced the molecular clock. A, Representative bioluminescence recordings from two separate slices, one control (black), the other WIN treated (red), over 8 d. Treatment artifact is indicated by the black rectangle. B, Box plot of phase shifts of all the cultures after treatment with either control (white) or WIN (red), DPCPX (light gray), or WIN+DPCPX (dark gray; *p < 0.05). C, Representative bioluminescence recordings from two separate slices, one control (black) and the other adenosine treated (blue), over 7 d. Treatment artifact is indicated by the black rectangle. D, Box plot of phase shifts of SCN slice cultures after treatment with either control (black) or adenosine (blue; *p < 0.05). (Adapted from Figure 10 in Hablitz et al., 2020.)

