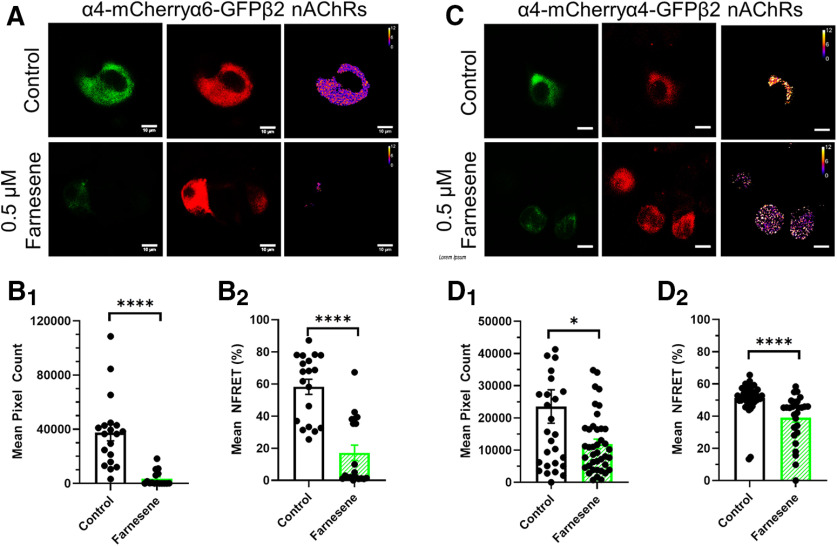
Figure 5.
Farnesene favors high-sensitivity nAChRs in neuro-2a cells. Representative neuro-2a cells transfected with α4-mCherry, α4-GFP or α6-GFP, and β2wt nAChR subunits to produce (A) α4-mCherryα6-GFPβ2 nAChRs or (C) α4-mCherryα4-GFPβ2 nAChRs. Scale bar, 10 μm. Mean NFRET pixel count (B1, D1) and NFRET percentage (B2, D2) treated as control or with 0.5 μm farnesene for (A) α4-mCherryα6-GFPβ2 nAChRs or (C) α4-mCherryα4-GFPβ2 nAChRs. All data are mean ± SEM; *p < 0.05, ****p < 0.001; unpaired t test. Exact p values are given in Results. Dots within bars represent the values from individual cells within the designated treatment group; n > 30 cells per condition.

