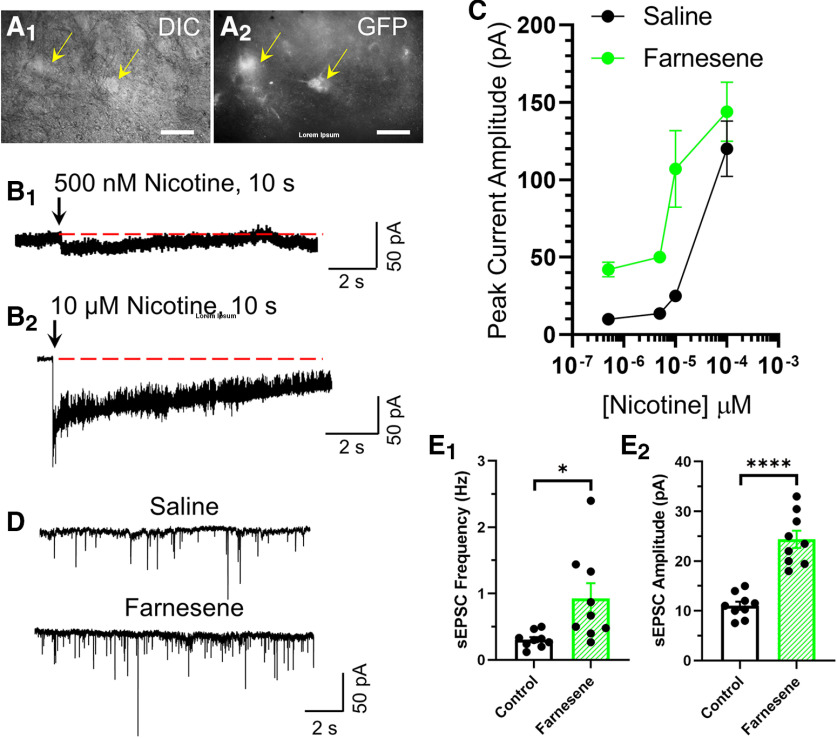
Figure 7.
Farnesene enhances the affinity and potency of nicotine. Representative images of VTA pDA neurons in a brain slice (bregma −3.1) were identified through the presence of α6-GFP nAChRs in IR-DIC (A1) and GFP fluorescence (A2) imaging modes. Scale bars, 20 μm. B, Representative inward currents from VTA pDA neurons (α6-GFP-positive) with 10-s applications of 500 nm (B1) or 10 μm (B2) nicotine in voltage-clamp mode. Arrows indicate start of nicotine puff application and dotted red lines indicate baseline before puff and the duration of nicotine application. C, Average nicotine concentration response of peak-current amplitude of VTA pDA neurons (n = 7 neurons/4 mice and 5 neurons/3 mice per nicotine concentration for saline-treated and farnesene-treated mice, respectively). D, Representative waveforms of sEPSCs from VTA pDA neurons recorded from saline-treated or farnesene-treated mice in the presence of 30 μm picrotoxin. E, Mean sEPSC frequency (E1) and amplitude (E2) in saline-treated and farnesene-treated mouse brain slices (n = 9 neurons/4 mice and 9 neurons/3 mice for saline-treated and farnesene-treated mice, respectively). For all assays, drug treatments were consistent with the CPP assay paradigm using 0.1 mg/kg farnesene. C, EI,2, Data are mean ± SEM *p < 0.05, ****p < 0.0001; unpaired t test. Exact p values are given in Results. Dots within bars represent the values from individual neurons within the designated treatment group.

