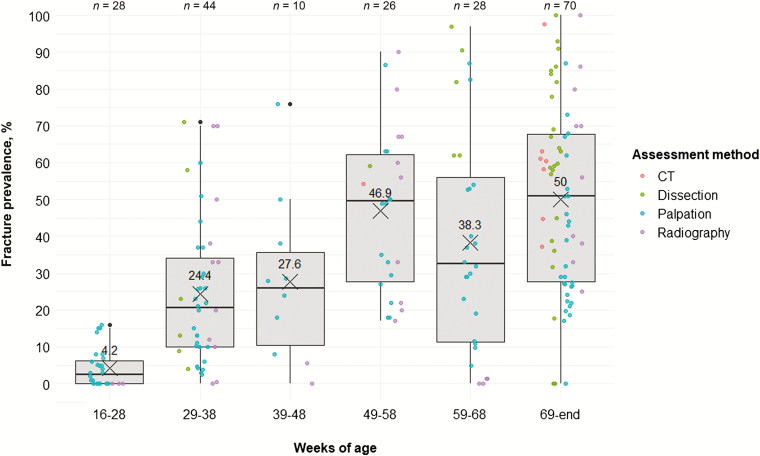
Figure 2.
Keel bone fracture prevalence (%) across age categories. Colors indicate the assessment method used. Boxplots show medians and interquartile and absolute ranges of raw data plus outliers. The cross and numbers indicate mean prevalence. n indicates the number of entries within one category.

