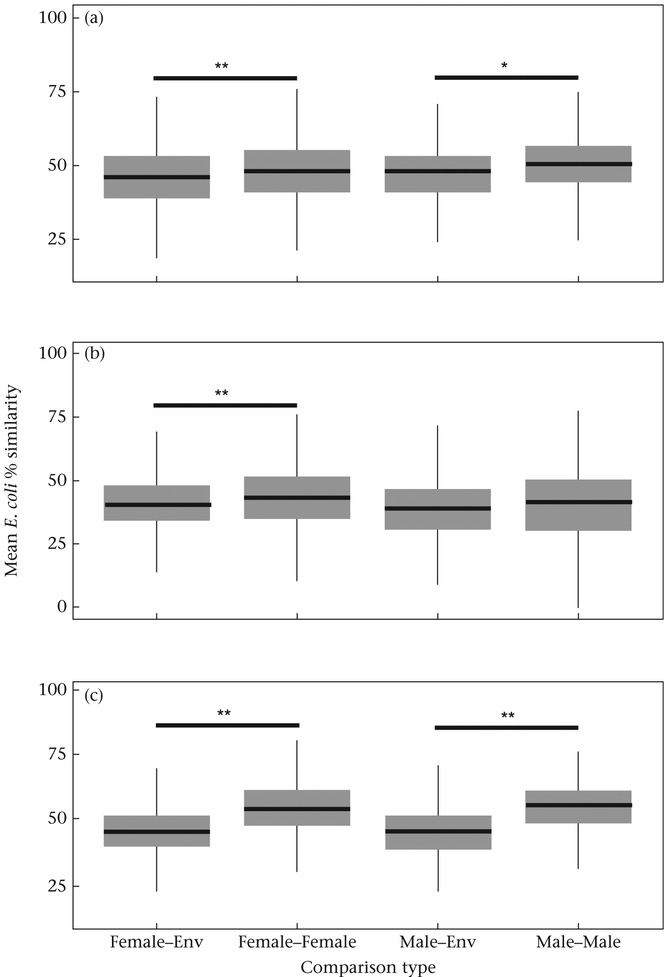
Figure A1.
Box plots of comparisons between macaque–macaque and macaque–environmental E. coli isolates by sex, at sampling time points (a) T0, (b) T1 and (c) T2. Boxes indicate the 25th and 75th percentiles. The heavy line indicates the median. Whiskers represent 1.5 times the interquartile range of the data. P values are from Wilcoxon two-sample tests.
*P < 0.05; **P < 0.01.

