
Table 2.
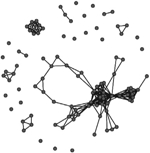
Characteristics of the three E. coli transmission networks constructed using the bacterial genotypic profiles
| Phase I (T0 to T1,
arrows A and B in Fig. 1) |
Phase II (T1 to T2,
arrows C and D in Fig. 1) |
Overall across both
phases (T0 to T1 to T2, all arrows in Fig. 1) |
|
|---|---|---|---|
| Connected individuals (nodes with at least one edge) | 56 | 78 | 97 |
| Transmission links (edges) | 244 | 342 | 586 |
| Mean ± SE degree | 6.8 ± 5.6 | 11.7 ± 7.8 | 12.3 ± 8.7 |
| Graph | 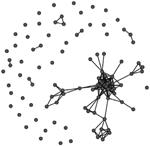 |
 |
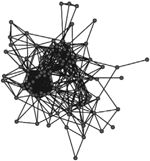 |
Unweighted links were assigned between any two macaques that shared an identical strain of E. coli (>90% similarity in pulsotypes) across adjacent sampling events, or within the same sampling event at the end of the corresponding behavioural data collection phase(s). Phases represent the two periods of behavioural data collection. T0, T1 and T2 represent sampling events that flanked behavioural data collection.