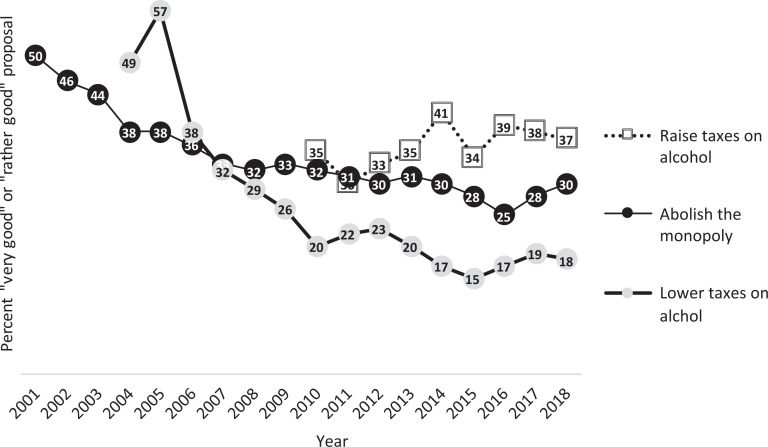
Figure 1.
Public opinion in relation to policy proposals concerning alcohol in Sweden 2001–2018 (percentage “very good” or “good” proposal”).
Source: National Society, Opinion, Media surveys 2001–2018.
Note. Some years the questions were part of a subset of the SOM survey and some years they were included in all questionnaires. The number of respondents for the monopoly question in 2001 was 3461, 3417 for the lower tax question in 2004, and between 3001–3334 for the raise taxes question in 2011, 2013 and 2014. Other years the number of respondents for all questions varied between 1513–1751.

