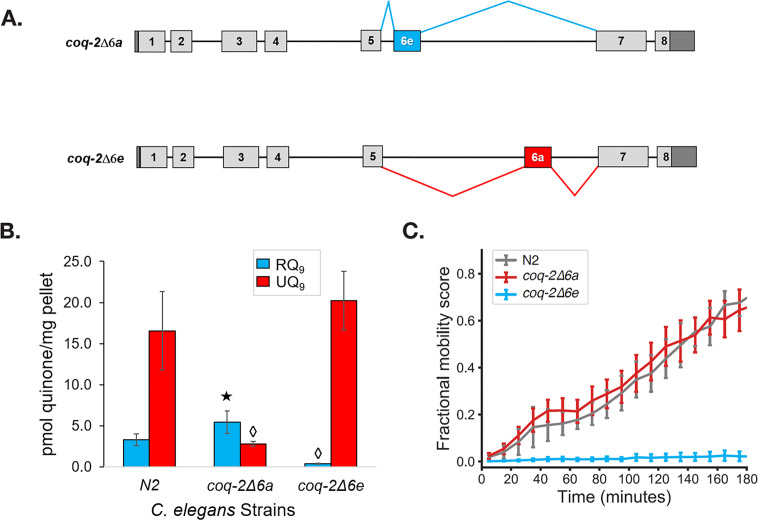
Figure 5. The C. elegans coq-2 edited strains and effects of exon 6a and 6e deletions on quinone biosynthesis.
(A) Mutant strains were generated in C. elegans by deletion of exon 6a (coq-2∆6a) or exon 6e (coq-2∆6e). (B) Deletion of exon 6a from the coq-2 gene significantly increased the level of RQ9 (p=0.013) and significantly decreased UQ9 (p<0.001) compared to the N2 control. By contrast, the deletion of exon 6e decreased RQ9 to a negligible level (p<0.001) and slightly increased the level of UQ9 (p=0.130) compared to N2. Statistically significant increases and decreases with respect to N2 levels are denoted with ★ and ◊, respectively; error bars reflect standard deviation where N = 4. (C) Deletion of coq-2 exon 6e affects the ability of worms to survive extended KCN treatment. Wild-type (N2) and coq-2 mutant L1 worms were exposed to 200 µM KCN for 15 hr. KCN was then diluted 6-fold and worm movement was measured over 3 hr to track recovery from KCN exposure (see Materials and methods). Worms without exon 6e could not survive extended treatment with KCN while deletion of exon 6a had little effect on KCN survival. Cyanide titration is shown in Figure 5—figure supplement 1. Curves show the mean of four biological replicates and error bars are standard errors of the mean.


