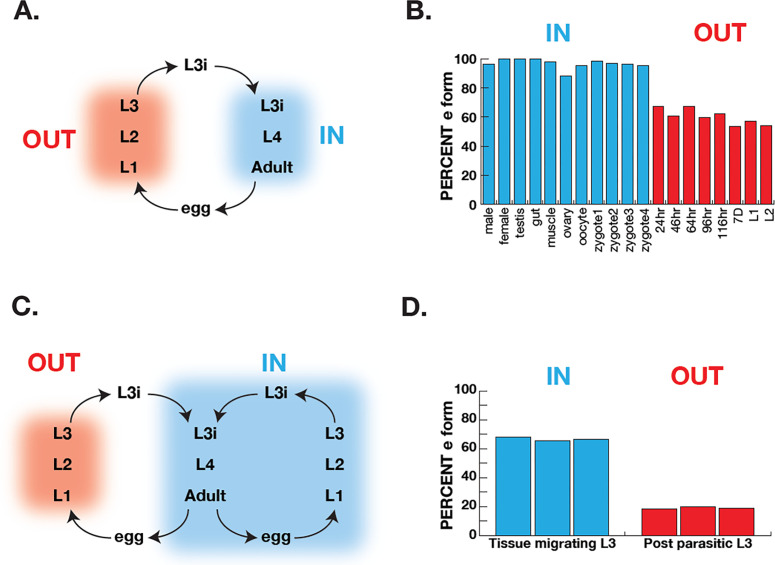
Figure 6. Correlation of COQ-2 splicing with change from aerobic to anaerobic life stages.
(A) Schematic of the life cycle of A. suum. ‘OUT’ denotes aerobically respiring free-living stages; ‘IN’ indicates stages living inside the host intestine. (B) Graph indicates the percentage of all COQ-2 transcripts that include the RQ-specific exon (Percent e-form) in a number of life cycle stages, sexes, and tissues. Timing of embryogenesis shows the post-fertilization time in hours. (C) Schematic of the life cycle of Strongyloides stercoralis. ‘OUT’ denotes aerobically respiring free-living stages; ‘IN’ indicates stages living inside the host. Note that egg, L1, L2, and L3 can either develop inside or outside the host. (D) Graph indicates the percentage of all COQ-2 transcripts that include the RQ-specific exon (Percent e-form) in L3 larvae that either developed outside the host (OUT) or inside the host (IN). Data were derived from three individual replicates taken from published RNA-seq data (Stoltzfus et al., 2012).

