. 2020 Aug 18;9:e58057. doi: 10.7554/eLife.58057

Figure 1. VPA0226 mediates bacterial egress from the host cell.

(A) HeLa cells were infected with CAB2 or CAB2Δvpa0226 for 1, 3, 5, and 7 hr PGT. Host cell lysates were serially diluted and plated onto MMM agar plates for intracellular bacterial colony counting (CFU/mL). Numbers are expressed as an average of three technical replicates for one of three independent experiments. Error bars represent standard deviation from the mean. Asterisks represent statistical significance (*=p < 0.05) using two-way ANOVA and Turkey’s multiple comparison test. (B) HeLa cells were infected with CAB2, CAB2Δvpa0226, CAB2Δvpa0226+WT, or CAB2Δvpa0226+S/A for 7 hr PGT. Host cell lysates were serially diluted and plated onto MMM agar plates for intracellular bacterial colony counting (CFU/mL). Numbers are expressed as an average of three technical replicates for one out of three independent experiments. Error bars represent standard deviation from the mean. Asterisks represent statistical significance (***=p < 0.001, ****=p < 0.0001) using one-way ANOVA and Turkey’s multiple comparison test. (C) Confocal micrographs of HeLa cells infected with GFP-expressing (green) CAB2, CAB2Δvpa0226, CAB2Δvpa0226+WT, or CAB2Δvpa0226+S/A for 7 hr PGT. Host cell actin was stained with Alexa 680-phalloidin (magenta) and DNA was stained with Hoechst (blue). Scale bars = 25 μm. (D, relative to C) Quantification of HeLa cells containing intracellular bacteria per quadrant of slide. Numbers were normalized to CAB2 and are expressed as an average of three independent experiments. Error bars represent standard deviation from the mean. Asterisks represent statistical significance (****=p < 0.0001) using one-way ANOVA and Turkey’s multiple comparison test.

Figure 1.

Figure 1—figure supplement 1. VPA0226 is GCAT lipase that contributes to bacterial cell egress but does not contribute to V. parahaemolyticus’ escape from its containing vacuole.

Figure 1—figure supplement 1.

(A) Sequence alignment between the Salmonella T3SS2 effector SseJ and the V. parahaemolyticus lipase VPA0226. Conserved active sites are boxed in red. (B) Sequence alignment between V. parahaemolyticus’ VPA0226 and bacterial glycerophospholipid acyltransferases (GCAT). Asterisks and yellow columns indicate conserved active sites. (C) HeLa cells were infected with CAB2, CAB2Δvpa0226, CAB2Δvpa0226+WT, or CAB2Δvpa0226+S/A for 7 hr PGT. Cell lysis was assessed by quantification of release of cytosolic lactate dehydrogenase (LDH). Numbers represent the average of nine technical replicates for one out of three independent experiments. Error bars represent standard deviation from the mean. Asterisks represent statistical significance (**=p < 0.01, ***=p < 0.001) using one-way ANOVA and Turkey’s multiple comparison test. (D) HeLa cells were infected with CAB2, CAB2Δvpa0226, CAB2Δvpa0226+WT, or CAB2Δvpa0226+S/A for 2 hr, after which samples were treated with 100 μg/mL gentamicin for 3 hr. Gentamicin was washed away and cells were incubated for additional 3 hr. Host cell supernatants were serially diluted and plated onto MMM agar plates for extracellular bacterial colony counting (CFU/mL). Numbers are expressed as an average of three technical replicates for one out of three independent experiments. Error bars represent standard deviation from the mean. Asterisks represent statistical significance (***=p < 0.001, ****=p < 0.0001) using one-way ANOVA and Turkey’s multiple comparison test. (E) Caco-2 cells were infected with either CAB2, CAB2Δvpa0226, CAB2Δvpa0226+WT or CAB2Δvpa0226+S/A for 1, 3, 5, and 7 hr PGT. Host cell lysates were serially diluted and plated onto MMM agar plates for intracellular bacterial colony counting (CFU/mL). Numbers are expressed as an average of three technical replicates for one of three independent experiments. Error bars represent standard deviation from the mean. Asterisks represent statistical significance (****=p < 0.0001) using 2way ANOVA and Turkey’s multiple comparison test.
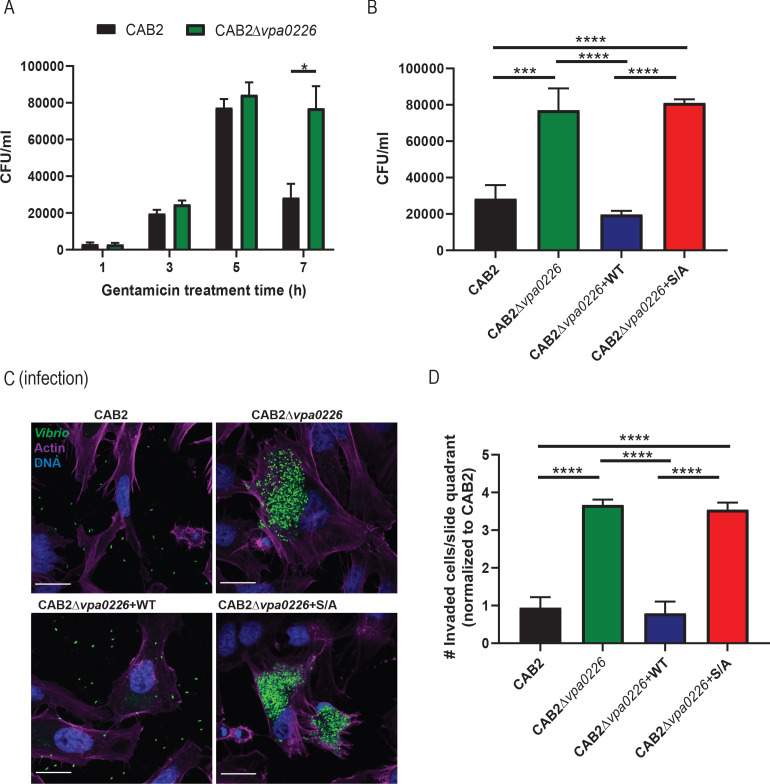
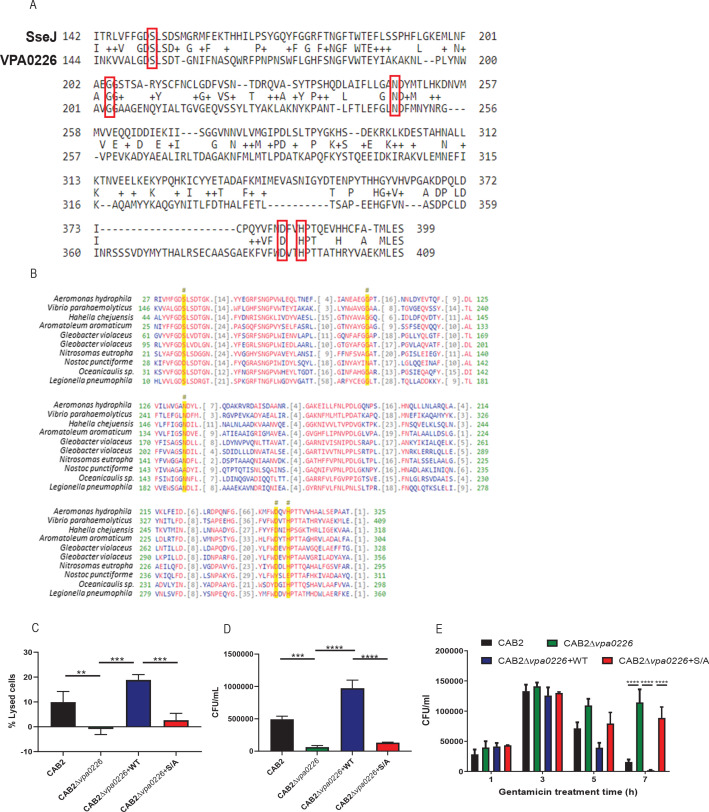
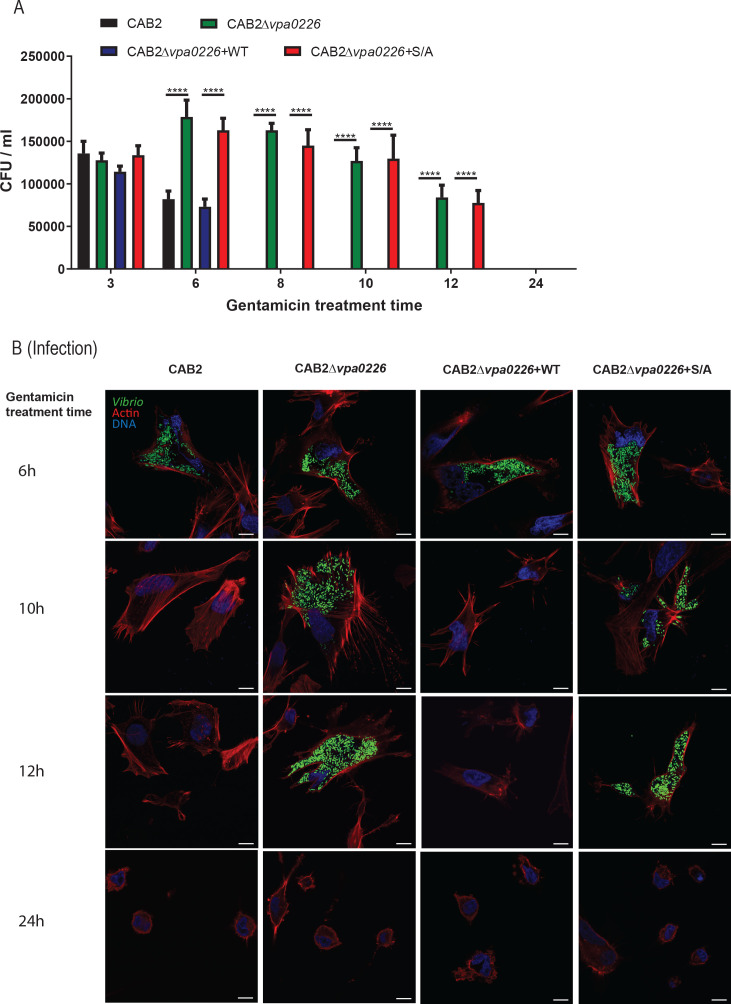
Figure 1—figure supplement 2. Extended time course for gentamicin protection assay.

Figure 1—figure supplement 2.

(A) HeLa cells were infected with CAB2, CAB2Δvpa0226, CAB2Δvpa0226+WT, or CAB2Δvpa0226+S/A for 2 hr, treated with 100 μg/mL gentamicin for 1 hr followed by treatment with 10 μg/mL gentamicin for the remainder of the infection. Host cell lysates were serially diluted and plated onto MMM agar plates for intracellular bacterial colony counting (CFU/mL). Numbers are expressed as an average of three technical replicates for one of three independent experiments. Error bars represent standard deviation from the mean. Asterisks represent statistical significance (****=p < 0.0001) using two-way ANOVA and Turkey’s multiple comparison test. (B) Confocal micrographs of HeLa cells infected with GFP-expressing (green) CAB2, CAB2Δvpa0226, CAB2Δvpa0226+WT, or CAB2Δvpa0226+S/A in a extended time course gentamicin protection assay as detailed above in (A). Host cell actin was stained with rhodamine phalloidin (red) and DNA was stained with Hoechst (blue). Scale bars = 10 μm.