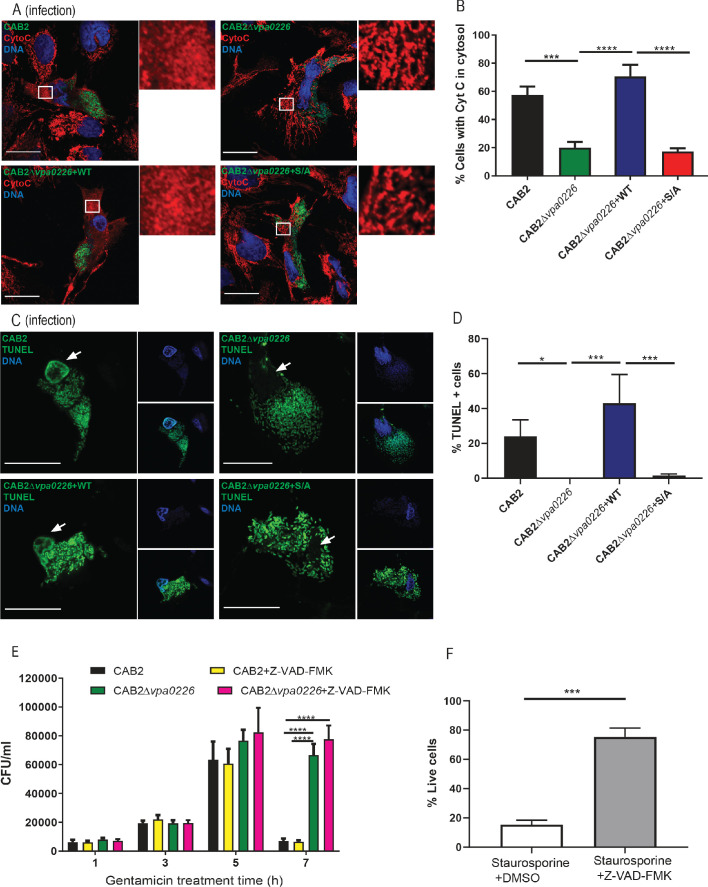
(A) Confocal micrographs of HeLa cells infected with GFP-expressing (green) CAB2, CAB2Δvpa0226, CAB2Δvpa0226+WT, or CAB2Δvpa0226+S/A tested for release of Cytochrome C (Cyto C) from the mitochondria into the cytosol was assessed by staining of Cyto C with anti-Cytochrome C antibody (red) and DNA was stained with Hoechst (blue) at 5 hr PGT. Scale bars = 25 μm. White boxes frame magnified areas. (B, relative to A) Quantification of HeLa cells exhibiting cytosolic CytoC. Numbers are expressed as an average of three independent experiments for 150 cells counted for each sample. Error bars represent standard deviation from the mean. Asterisks represent statistical significance (***=p < 0.001, ****=p < 0.0001) using one-way ANOVA and turkey’s multiple comparison test. (C) Confocal micrographs of HeLa cells infected with GFP-expressing (green) CAB2, CAB2Δvpa0226, CAB2Δvpa0226+WT, or CAB2Δvpa0226+S/A followed by TUNEL staining (green) of host cell nuclei and DNA staining with Hoechst (blue) at 5 hr PGT. Arrows point to TUNEL positive or negative nuclei. Scale bars = 25 μm. (D, relative to C) Quantification of HeLa cells positive for TUNEL staining. Numbers are expressed as an average of three independent experiments for 150 cells counted for each sample. Error bars represent standard deviation from the mean. Asterisks represent statistical significance (*=p < 0.05, ***=p < 0.001) using one-way ANOVA and turkey’s multiple comparison test. (E) HeLa cells were infected with CAB2 or CAB2Δvpa0226 for 2 hr, in the absence or presence of 50 μM Z-VAD-FMK. Next, samples were treated with 100 μg/mL gentamicin for 1, 3, 5, and 7 hr, in the absence or presence of Z-VAD-FMK. Host cell lysates were serially diluted and plated onto MMM agar plates for intracellular bacterial colony counting (CFU/mL). Asterisks represent statistical significance (****=p < 0.0001) using two-way ANOVA and turkey’s multiple comparison test. (F) HeLa cells were treated with 1.2 μM staurosporine for 24 hr in the absence or presence of 50 μM Z-VAD-FMK and cell viability was assessed by staining with Trypan Blue. Asterisks represent statistical significance (***=p < 0.001) using Student’s two tailed t-test.


