. 2020 Jul 15;9:e59991. doi: 10.7554/eLife.59991

Figure 1. Cryo-EM reconstruction of the holocomplex.

(A) 2D class averages showing side-views of complexes with one or two MICU1-MICU2 heterodimers associated (top and bottom panels, respectively). (B–E) Cryo-EM reconstruction of the holocomplex, shown in orthogonal views. Densities are colored accordingly: MCU (yellow), EMRE (orange), MICU1 (green), MICU2 (blue), and nanodisc (semitransparent gray). Numbers in (E) represent the locations of EMRE subunits. The location of where EMRE 4 would be expected to bind is indicated by parentheses (D–E).

Figure 1.

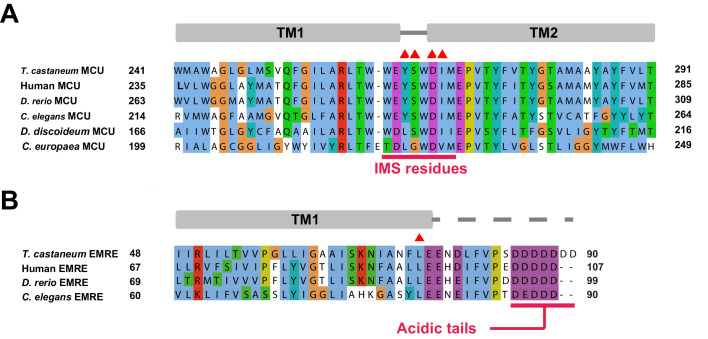
Figure 1—figure supplement 1. Sequence alignments of MCU and EMRE.

Figure 1—figure supplement 1.

(A) The amino acid sequences of transmembrane regions of T. castaneum, C. europaea, D. discoideum, C. elegans, D. rerio (Zebrafish) and human MCUs are aligned and colored according to the ClustalW convention (NCBI Reference Sequence: XP_008192975.1 (T. castaneum), UniProt accession numbers: W2SDE2, Q54LT0, Q21121, Q08BI9 and Q8NE86, respectively). Secondary structures are indicated with cylinders representing α-helices, and residues facing the intermembrane space are indicated with a red line. Residues involved in MICU1-binding are highlighted with red triangles. (B) The amino acid sequences of T. castaneum, C. elegans, D. rerio (Zebrafish) and human EMREs are aligned and colored in the same manner (UniProt accession numbers: D6X268_TRICA, Q9U3I4, A0A0J9YJ98 and Q9H4I9, respectively). Secondary structures are indicated with bars representing α-helices, solid lines representing structured loop regions, and dashed lines representing disordered regions. The acidic C-terminal tails of EMRE proteins are highlighted with a red line. Leu 92 is noted with a red triangle.
Figure 1—figure supplement 2. Comparison of the MICU1 receptor sites in human and beetle MCU-EMRE complexes.
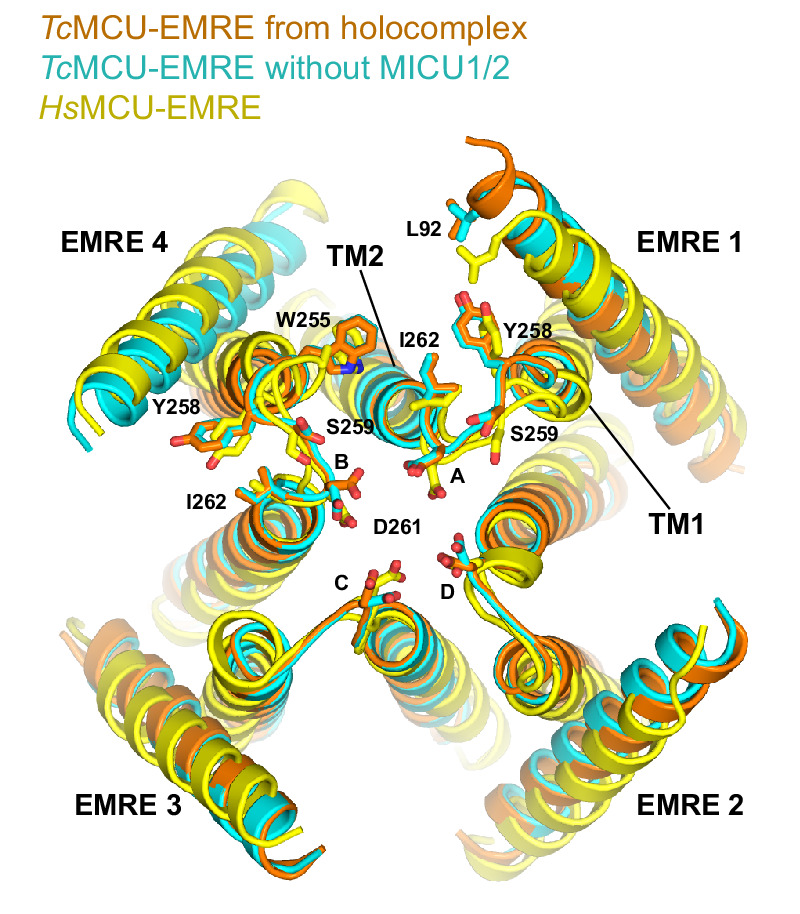
Figure 1—figure supplement 2.

Superposition of TcMCU-EMRE from the holocomplex (gold), TcMCU-EMRE without MICU1-MICU2 (cyan), and human MCU-EMRE (yellow, PDB: 6O58) is shown from the perspective of the IMS. MCU and EMRE are shown as cartoons. Residues involved in MICU1 binding are labeled and depicted as sticks (RMSD between these for human and beetle MCU/EMRE is 1.5 Å for Cα atoms).
Figure 1—figure supplement 3. Purification of the MCU-EMRE-MICU1-MICU2 holocomplex under resting ([Ca2+]free <1 nM) conditions and cryo-EM micrograph.

Figure 1—figure supplement 3.

(A) Size exclusion chromatography (SEC) profile of the purified holocomplex. Peak fractions between the dashed lines were collected for cryo-EM analysis. (B) SDS-PAGE analysis of the SEC fractions (Coomassie stained). Protein components are labeled. (C) Portion of a representative micrograph (defocus of −2.5 μm). Automatically picked particles are circled in green.
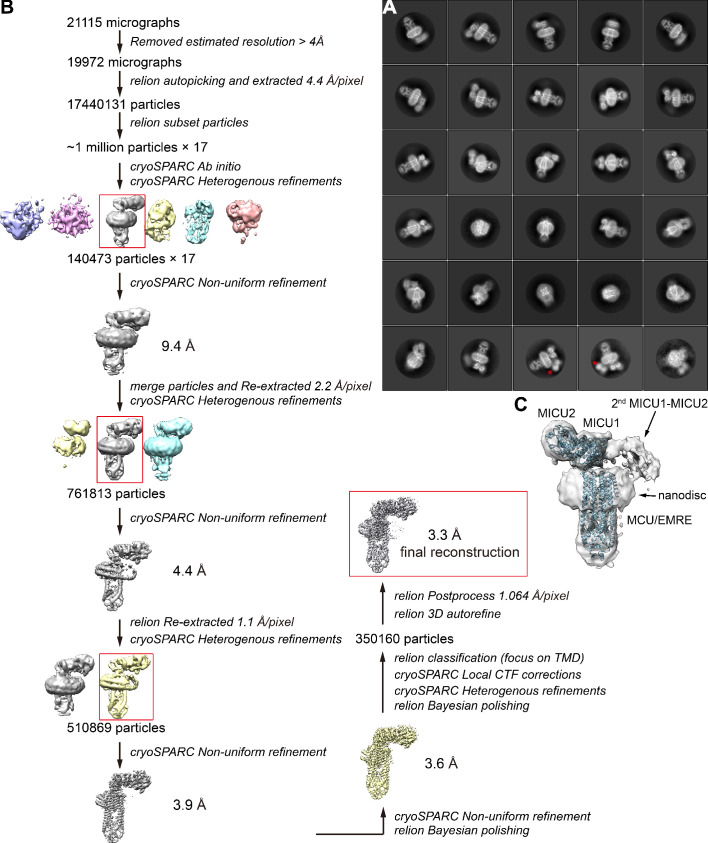
Figure 1—figure supplement 4. Flowchart of cryo-EM data processing of holocomplex.

Figure 1—figure supplement 4.

(A) Representative 2D class averages ranked in order of class distribution (highest to lowest occupancy from upper left to lower right). Asterisks denote a second MICU1-MICU2 complex in certain classes. (B) Flowchart of cryo-EM data processing and 3D reconstruction. (C) Cryo-EM map (semitransparent representation, ~10 Å resolution) from the ~2% of particles that contain two MICU1-MICU2 heterodimers per channel assembly. The atomic structure of the holocomplex containing one MICU1-MICU2 heterodimer is shown in cartoon representation for comparison.
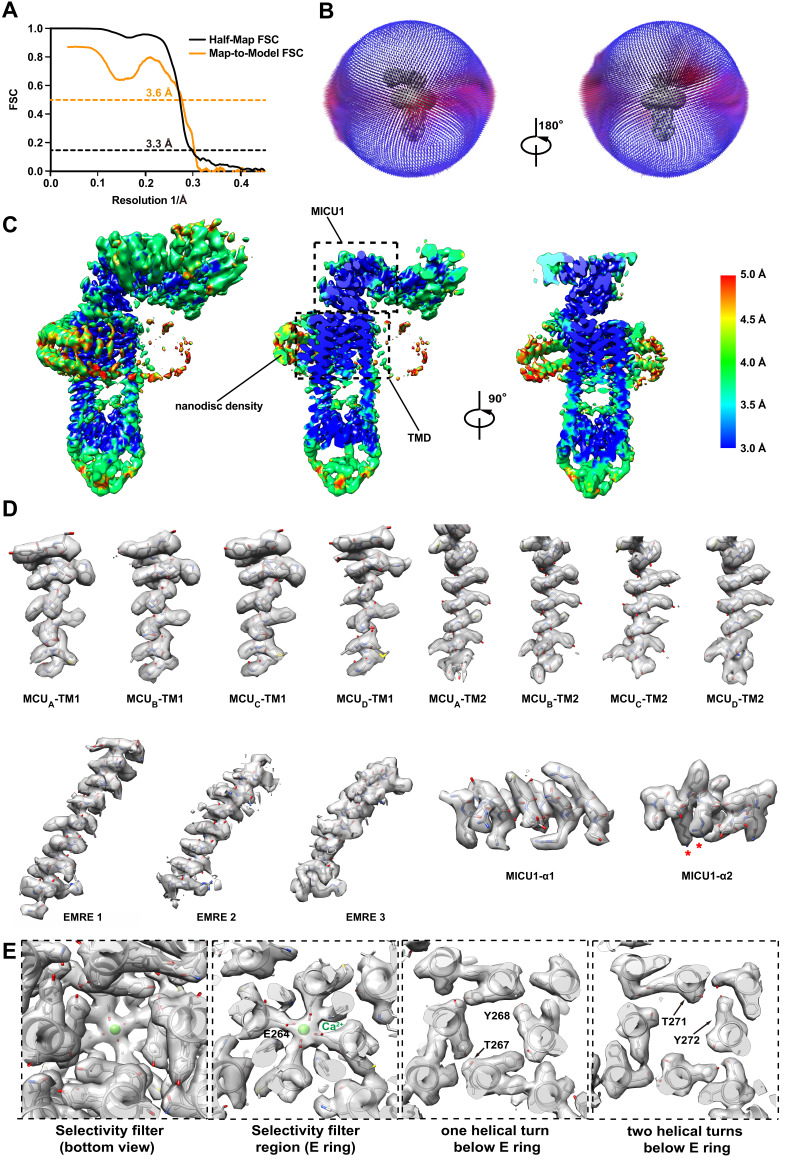
Figure 1—figure supplement 5. Cryo-EM analysis of the holocomplex.

Figure 1—figure supplement 5.

(A) FSC curves of the final 3D reconstruction. The half-map (black) and map-to-model (orange) FSC curves are shown (dotted lines indicate 0.143 and 0.5 levels and corresponding resolutions). (B) Euler angle distribution plot of the final 3D reconstruction. (C) Local resolution estimation (calculated with Resmap). The unsharpened map is colored as indicated. Middle and right panels are slices through the map. (D–E). EM densities for indicated regions of the atomic model.
Figure 1—figure supplement 6. The EF-hands of MICU1 and MICU2 are in apo conformations in the holocomplex structure.

Figure 1—figure supplement 6.

Local densities (transparent surface representations) of the four EF-hand domains are shown in the context of the atomic model (cartoon and sticks). Densities for Ca2+ ions are absent and the Ca2+-binding residues (asterisks) have poorly defined density.