. 2020 Jul 15;9:e59991. doi: 10.7554/eLife.59991

Figure 4. Ca2+-dependent changes in MICU1-MICU2.

(A) Cartoon representation of the apo MICU1-MICU2 heterodimer. Gray spheres denote EF-hand residues. (B) Overall structure of Ca2+-bound MICU1-MICU2. Red spheres indicate bound Ca2+ ions. (C–D) Bend between MICU1 and MICU2 induced by Ca2+ binding (C, apo; D, Ca2+-bound). Overall structures are shown from the side with semitransparent molecular surfaces. (E) Superposition of apo (gray) and Ca2+-bound (green) MICU1 highlighting a rotation of the UID upon Ca2+ binding. (F) Cryo-EM density depicting the Ca2+-bound MICU1-MICU2 complex associated with a lipid nanodisc.

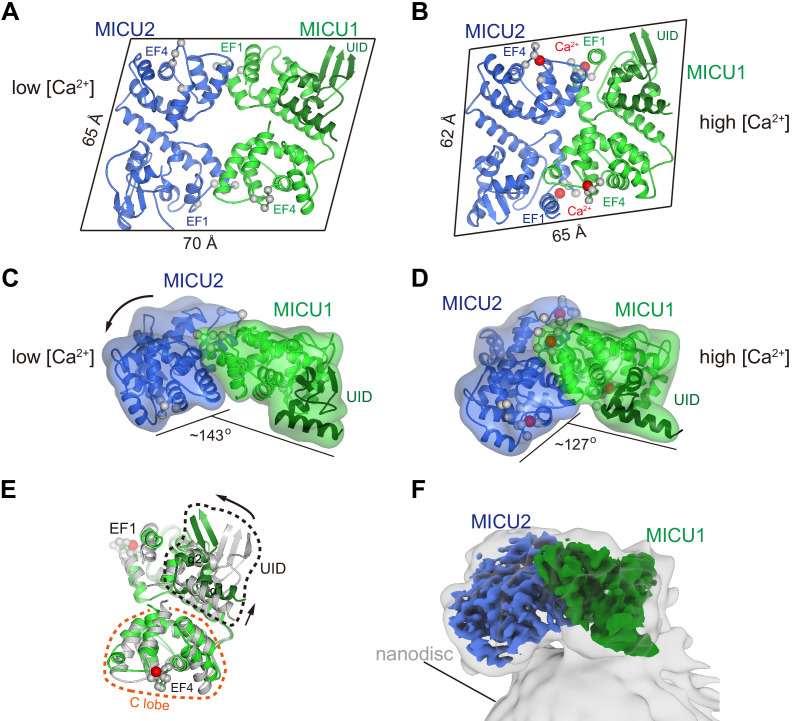
Figure 4.

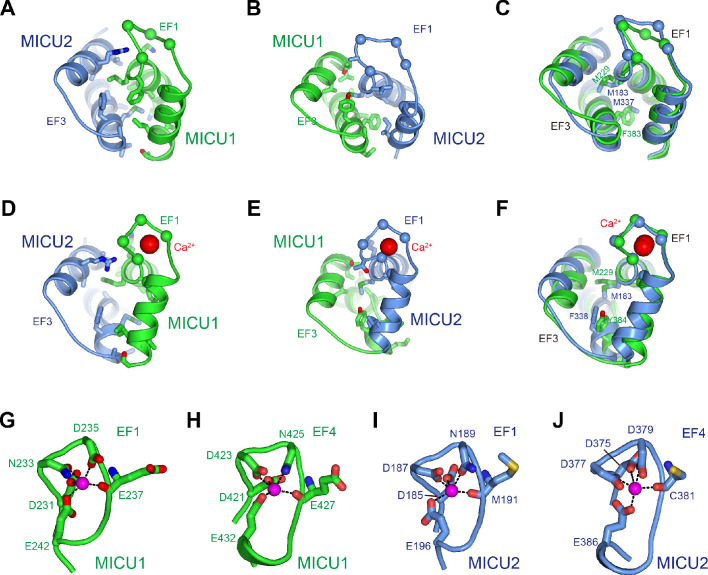
Figure 4—figure supplement 1. MICU1-MICU2 interfaces and Ca2+-binding.

Figure 4—figure supplement 1.

(A and B) Interfaces between MICU1 and MICU2 in the Ca2+-free heterodimer. Depictions are for the interface between MICU1-EF1 and MICU2-EF3 (A) and for the interface between MICU1-EF3 and MICU2-EF1 (B). Residues within the interfaces are shown as sticks. Spheres represent Cα locations of amino acids within EF-hands that would coordinate Ca2+. (C) Superposition of the interfaces from (A–B), with amino acids at their centers labeled. (D–F) MICU1-MICU2 interfaces in the Ca2+ bound complex, depicted as for (A–C). Ca2+ ions are shown as red spheres. (G – J) Coordination of Ca2+ ions in the Ca2+-bound MICU1-MICU2 structure. The four EF-hand domains are shown as cartoons with amino acids that coordinate Ca2+ as sticks. Ca2+ ions are shown as purple spheres, with Ca2+-oxygen interactions depicted as dashed lines.
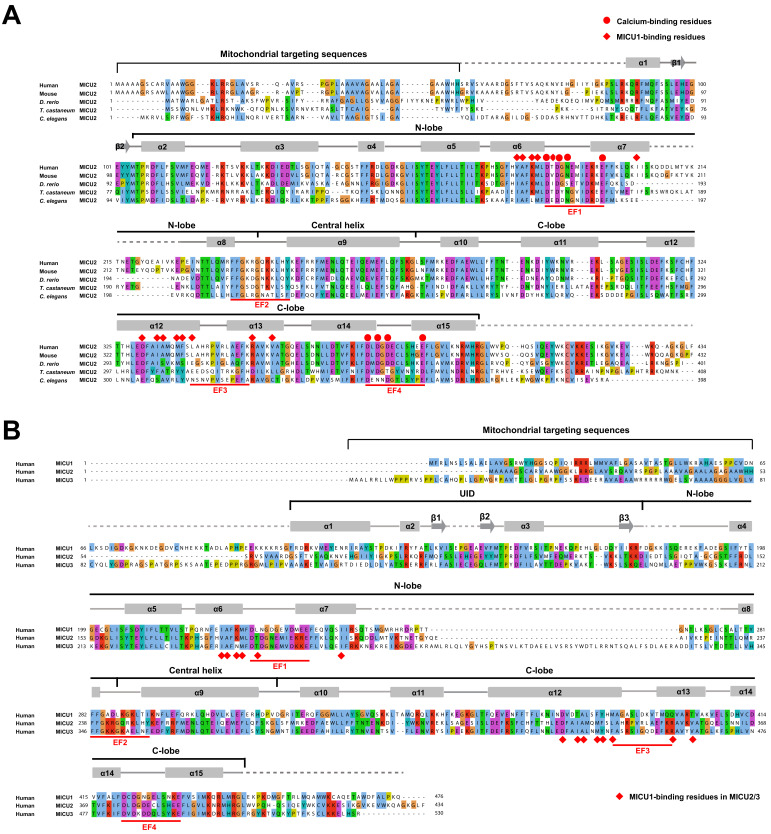
Figure 4—figure supplement 2. Structure based sequence alignments of MICU proteins.

Figure 4—figure supplement 2.

(A) Sequence alignment of MICU2 orthologs. The amino acid sequences of human, mouse (M. musculus), zebrafish (D. rerio), T. castaneum, and C. elegans MICU2 are aligned and coloured according to the ClustalW convention (UniProt accession numbers: Q8IYU8, Q8CD10, Q1LCY6, D6WQH5 and D7SFN6, respectively). Secondary structures are indicated with cylinders representing α-helices, arrows representing beta sheets, solid gray lines representing structured loops and dashed gray representing disordered loops. All the structural elements (N-lobe, Central helix and C-lobe) and 4 EF-hand motifs are highlighted. Residues involved in MICU1-binding and calcium-binding are highlighted with red dots and red diamonds, respectively. (B) Sequence alignment of human MICU1, MICU2 and MICU3. The secondary structure elements of human MICU1 are above the alignment. MICU2 residues that are involved in binding to MICU1 are conserved in MICU3 (red diamonds).
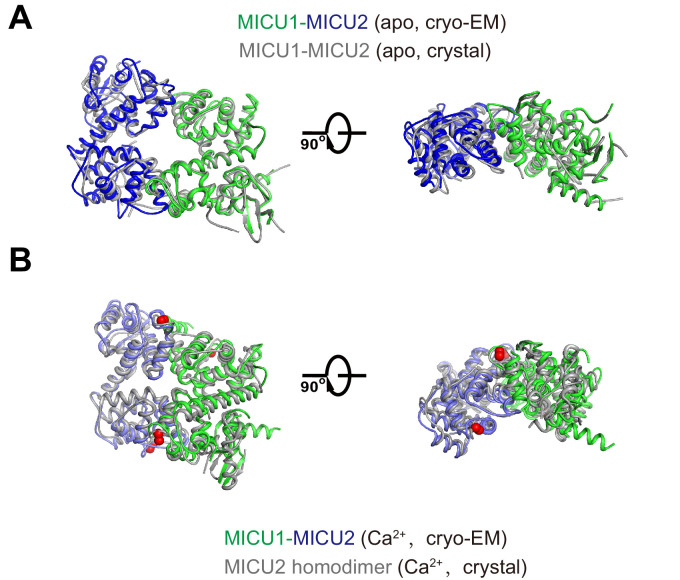
Figure 4—figure supplement 3. Comparisons of MICU1, MICU2 and MICU3 in apo and Ca2+-bound conformations.

Figure 4—figure supplement 3.

(A) Superposition of the MICU1-MICU2 heterodimer from the holocomplex (apo; green and blue) with an X-ray structure of an isolated apo MICU1-MICU2 heterodimer (gray, PDB: 6LE5). The RMSD is 0.8 Å for Cα atoms. Two orthogonal views are shown. (B) Superposition of the Ca2+-bound conformation of the MICU1-MICU2 heterodimer from our cryo-EM analysis (green and blue) with a Ca2+-bound X-ray structure of a MICU2-MICU2 homodimer (gray, PDB: 6IIH, Cα RMSD = 2.3 Å). Ca2+ ions are drawn as purple spheres.
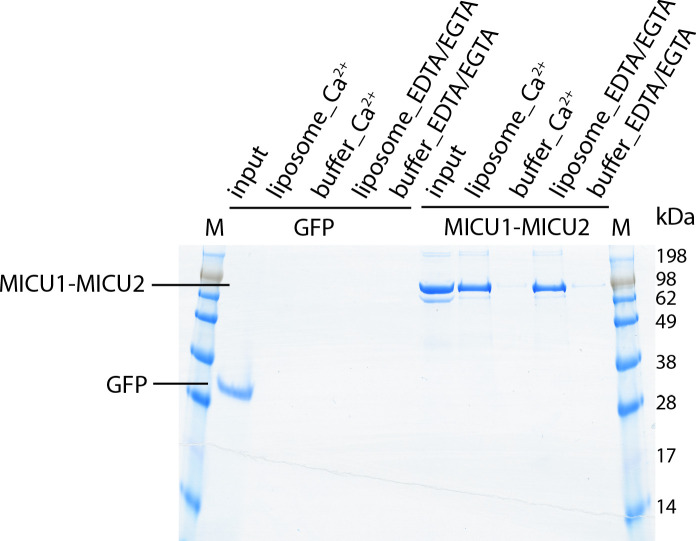
Figure 4—figure supplement 4. The MICU1-MICU2 regulatory complex binds to liposomes in both Ca2+ and Ca2+-free conditions.

Figure 4—figure supplement 4.

Following ultracentrifugation of purified MICU1-MICU2 in the presence or absence of liposomes, and with and without Ca2+, pellets were resuspended and analyzed by Coomassie-stained SDS-PAGE. MICU1-MICU2 pellets with liposomes but remains in the supernatant when liposomes are not present (buffer). GFP is used as a control that does not associate with liposomes. Refer to Methods for details.
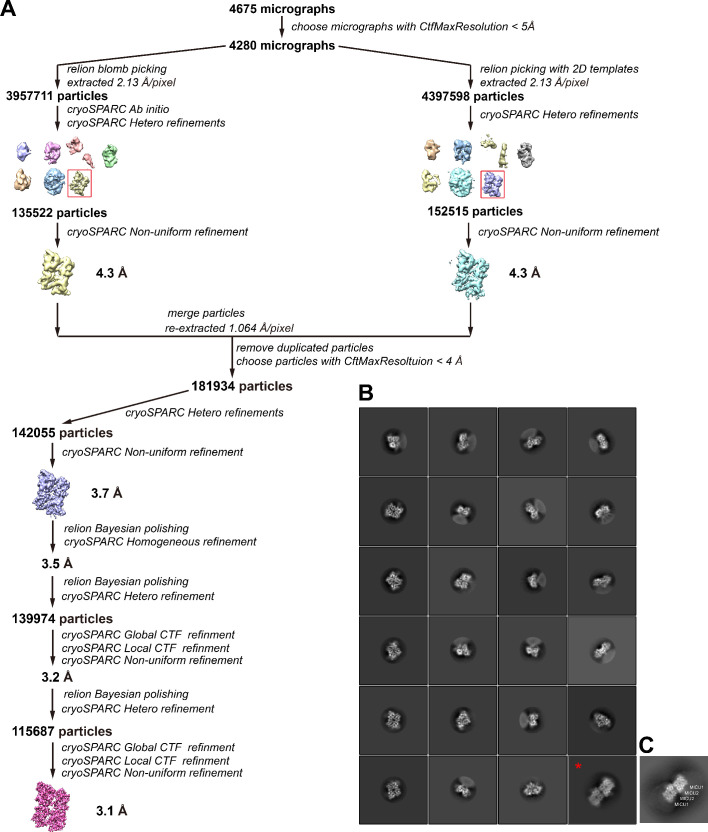
Figure 4—figure supplement 5. Flowchart of the cryo-EM data processing of the Ca2+-bound MICU1-MICU2 complex.

Figure 4—figure supplement 5.

(A) Flowchart of data processing and 3D reconstruction. (B) Representative 2D class averages. An asterisk denotes a class containing two MICU1-MICU2 assemblies (representing ~3% of particles). (C) A 2D projection of a dimer of MICU1-MICU2 heterodimers from the cryo-EM map of the human holocomplex under high [Ca2+] conditions (EMD-21643). The channel (MCU/EMRE) densities were removed for the projection. MICU2:MICU2 interfaces mediate a dimerization of MICU1-MICU2 heterodimers in that structure (Fan et al., 2020). The projection resembles the 2D class from (B) with two MICU1-MICU2 heterodimers (asterisk), which suggests, but does not prove, that a MICU2:MICU2 interface mediates the dimerization of MICU1-MICU2 heterodimers in a fraction of our cryo-EM data.
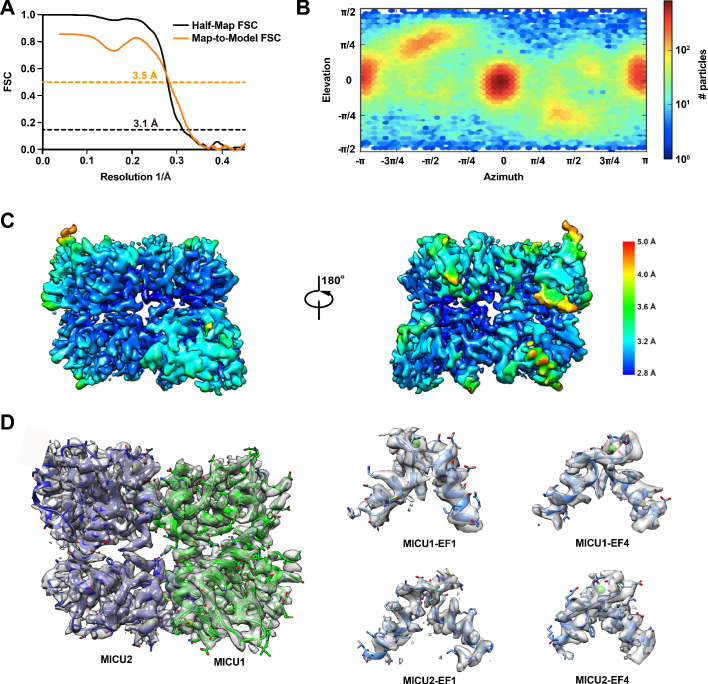
Figure 4—figure supplement 6. Cryo-EM analysis of the Ca2+-bound MICU1-MICU2 complex.

Figure 4—figure supplement 6.

(A) FSC curves of the final 3D reconstruction. The half-map (black) and map-to-model (orange) FSC curves are shown (dotted lines indicate 0.143 and 0.5 levels and corresponding resolutions). (B) Euler angle distribution plot of the final 3D reconstruction. (C) Local resolution estimation (calculated with Resmap). The unsharpened map is colored as indicated. Two views are shown. (D). EM densities for indicated regions of the atomic model. Calcium ions are depicted as green spheres.