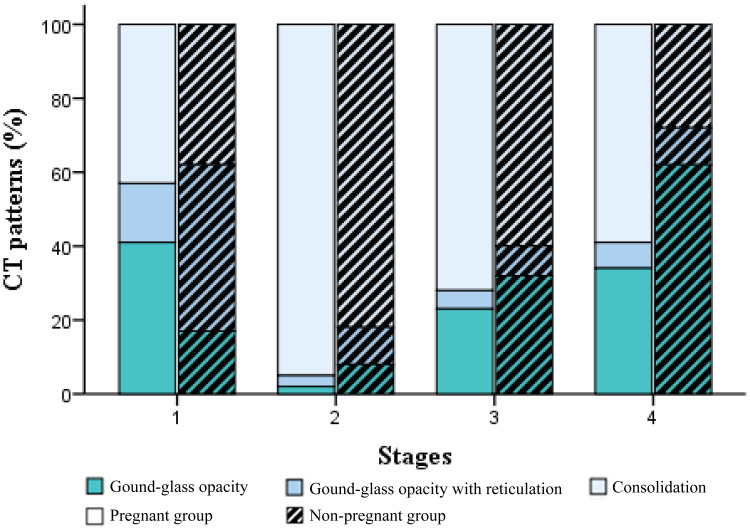
Figure 3.
CT patterns of different stages based on the time intervals from symptom onset in the pregnant and age-matched non-pregnant groups. Stacked bars represented the proportion of lesions including ground-glass opacity (GGO), GGO with reticulation, and consolidation (mixed and pure consolidation). Four stages based on the time intervals from symptom onset were depicted: stage 1(0–6 days), stage 2 (7–9 days), stage 3 (10–16 days), and stage 4 (>16 days).

