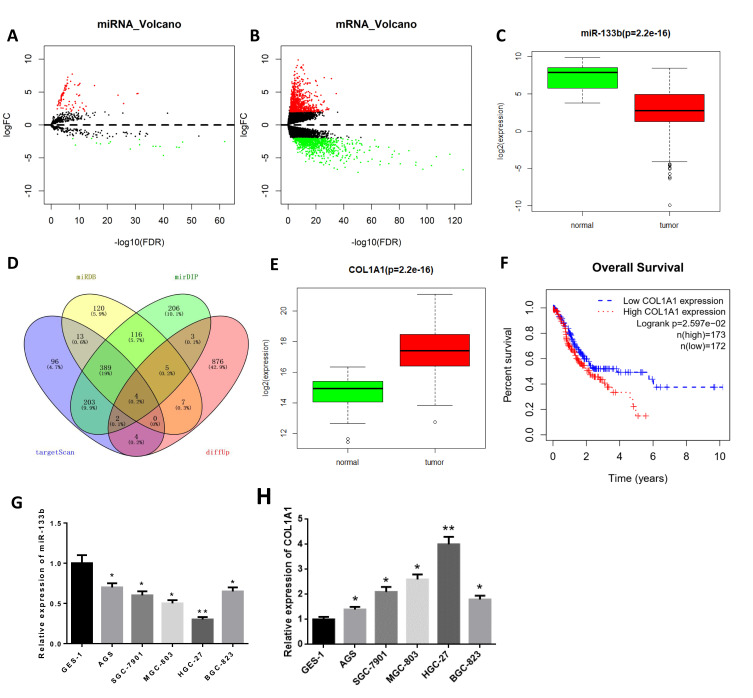
Figure 1.
miR-133b is downregulated while COL1A1 is upregulated in GC tissue and cells. (A, B) Volcano plots of (A) DEmiRNAs and (B) DEmRNAs in normal and tumor groups of GC from TCGA database; (C) Boxplot of miR-133b expression in normal and tumor groups (normal: n=45, tumor: n=444); (D) Venn diagram of predicted target genes of miR-133b and DEmRNAs; (E) Box plot of COL1A1 expression in normal and tumor groups (normal: n=32, tumor: n=373); (F) Survival curves of GC patients with high/low expression of COL1A1 (red line indicates high expression group and blue line indicates low expression group); (G, H) The expressions of (G) miR-133b and (H) COL1A1 in gastric epithelial cell line GES-1 and GC cell lines were detected by qRT-PCR. *P<0.05, **P<0.01.

