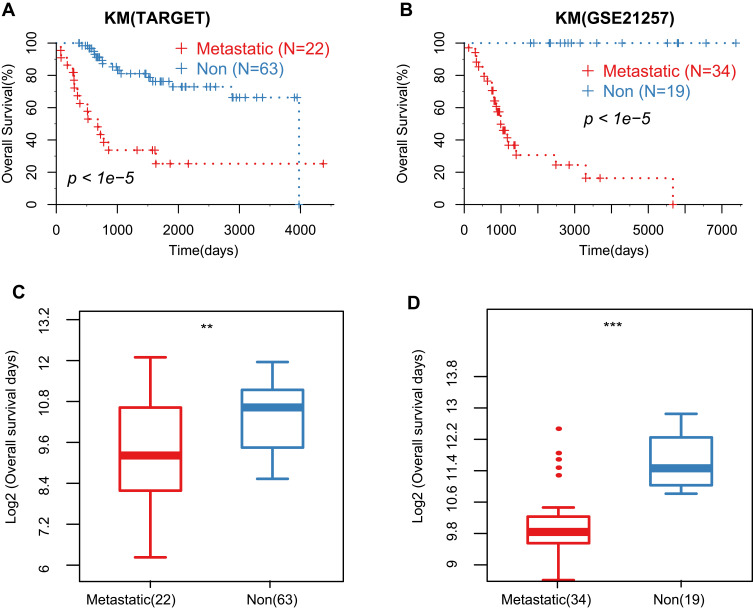
Figure 1.
The prognostic overall survival time between metastatic and non-metastatic samples. (A and B). Kaplan–Meier survival curve of the metastatic and non-metastatic groups in TARGET and GSE21257 cohorts; (C and D). Comparison of overall survival time (OS) between the metastatic and non-metastatic groups in TARGET and GSE21257 cohorts. **Represents P value <0.05, ***Represents P value <0.01.

