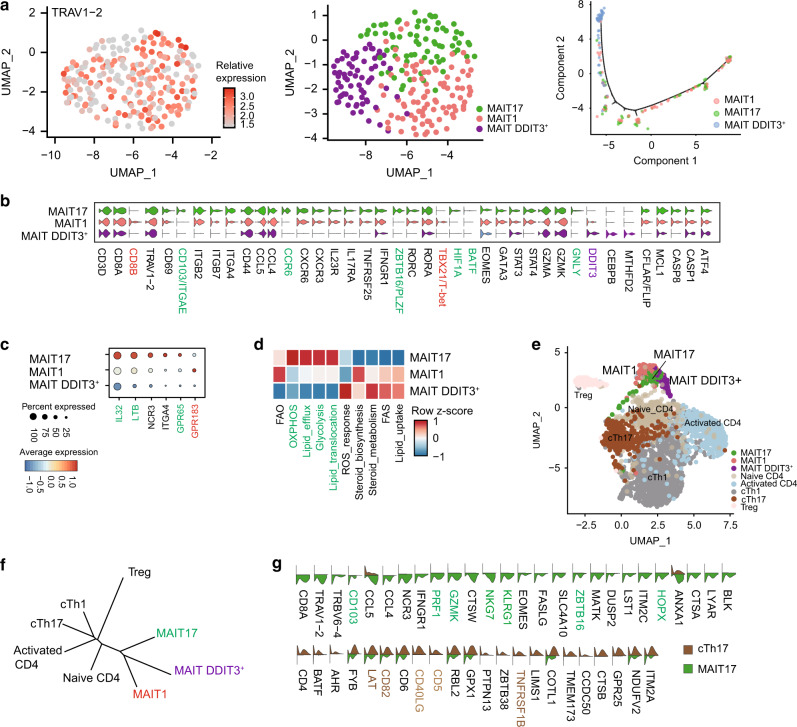
Fig. 4. MAIT cells in BALs of CAP children contain distinct clusters.
MAIT and CD4+ T cells isolated from the BALs of children with CAP were analyzed by single-cell RNA-sequencing (scRNAseq). a, Left panel: two-dimensional uniform manifold approximation and projection (2D-UMAP) plot displaying T cells expressing TRAV1-2; middle panel: unsupervised graphic clustering partitioned those cells into MAIT17, MAIT1, and DDIT3+ MAIT; right panel: pseudotime cell trajectory of MAIT cells. b Violin plots displaying expression of marker genes across MAIT cell clusters. c Dot plot showing expression of IL-32, LTB, NCR3, ITGA4, GPR65, and GPR183 among MAIT cell clusters. Dot size reflects the percentage of cells expressing the gene, while color intensity reflects the average gene expression level. d Heat map plotting of metabolic expression programs among MAIT subsets. e 2D-UMAP plot displaying three MAIT cell clusters and five CD4+ T. f Unrooted distance tree showing transcriptional similarities between CD4+T subsets and MAIT cell clusters. g Violin plots displaying differentially expressed genes between MAIT17 and Th17.

