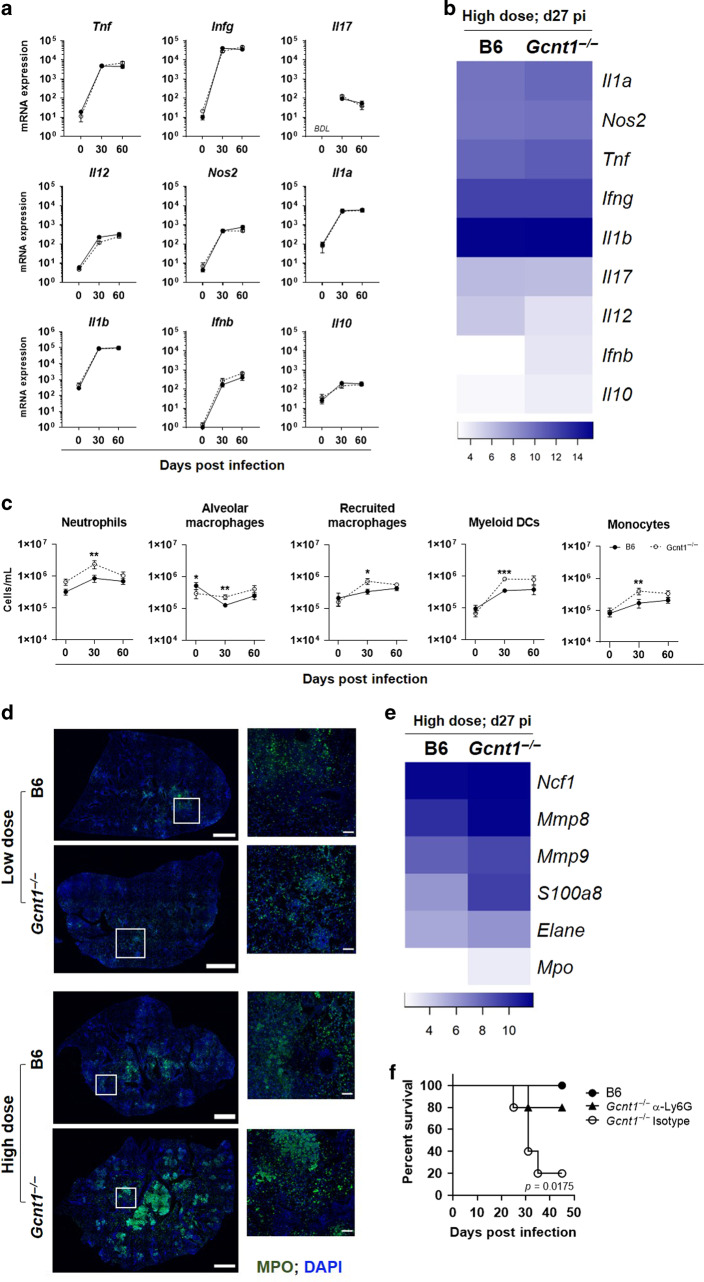
Fig. 2. Exacerbated neutrophilia drives increased susceptibility of Gcnt1−/− mice to Mtb infection.
a–e At the indicated timepoints post-infection, the lungs of C57BL/6 (B6; black circles) or Gcnt1−/− (open circles) mice infected by aerosol with a low or high dose of Mtb strain HN878 were harvested and a cellular suspension prepared. a, b, e The relative expression of the indicated genes was determined by real-time PCR. c Percentages of the indicated immune cell populations were determined by flow cytometry. The gating strategy is shown in Fig. S2A. d Representative images of MPO staining (green) in lung sections of B6 and Gcnt1−/− mice infected with low or high doses of Mtb. Sections were counterstained with DAPI (blue). Scale bars correspond to 1 mm (left panels) and 100μm (right panels). In a, c each dot represents the Mean ± SEM for 10 animals in two independent experiments. Non-infected animals (day 0) were used as controls. b, e Represented are heatmaps of log2 relative expression of the indicated genes in lung samples of B6 and Gcnt1−/− mice 27 days after high dose Mtb infection. f C57BL/6 (B6, black circles) or Gcnt1−/− mice were infected by aerosol with a high dose of Mtb strain HN878. On day 18 post-infection the Gcnt1−/− mice were treated with the neutrophil-depleting anti-Ly6G mAb (black triangles) or an isotype control (open circles). The weight of the animals (5 per group) was monitored to determine survival curves. Statistical analysis was performed per time point with unpaired two-tailed Mann-Whitney test (a, c) or with log-rank (Mantel-Cox) test for the Kaplan Meyer curve (f). * refer to statistic differences between C57BL/6 or Gcnt1−/− mice. *p < 0.05; **p < 0.01; ***p < 0.001.

