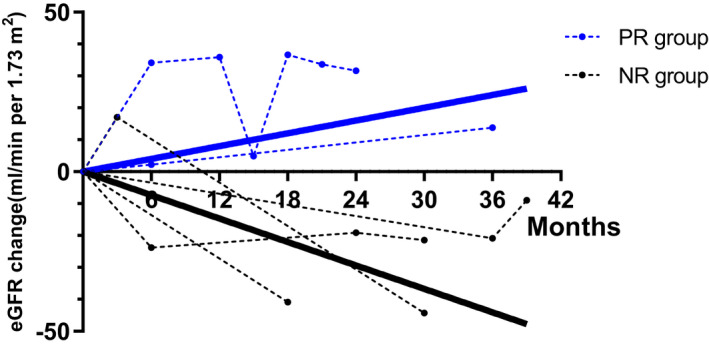
FIGURE 3.

Estimated glomerular filtration rate (eGFR) trends in urine protein partial remission (PR) patients (blue) and nonremission (NR) patients (black). eGFR changes in each patient are presented with dashed line. The lines with mean eGFR change linear regression slope of PR patients (blue continuous line) and NR patients (black continuous line) show better kidney prognosis of urine protein PR patients. PR (partial remission) group: urine protein at the 12th month of follow‐up decreased equal to or more than 50% compared to baseline; NR (none remission) group: urine protein at the 12th month of follow‐up decreased less than 50% compared to baseline.
