FIGURE 1.

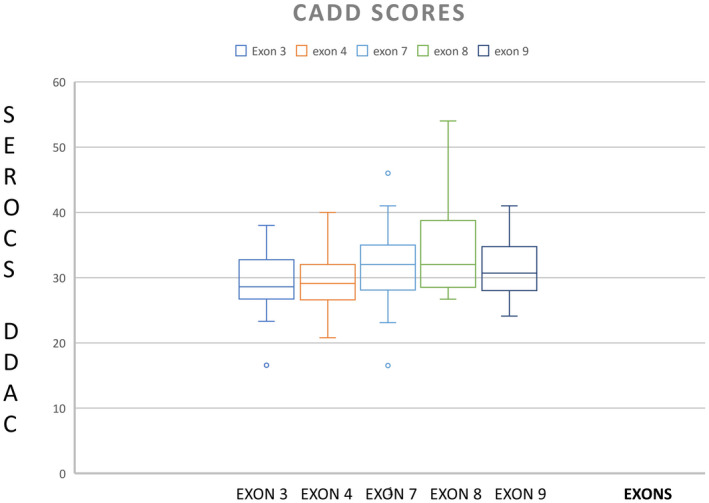
Box plot showing higher Combined Annotation Dependent Depletion score in the protein binding domain (exon 3 and 4) compared to the DNA binding domain (exon 7–9) of IRF6

Box plot showing higher Combined Annotation Dependent Depletion score in the protein binding domain (exon 3 and 4) compared to the DNA binding domain (exon 7–9) of IRF6