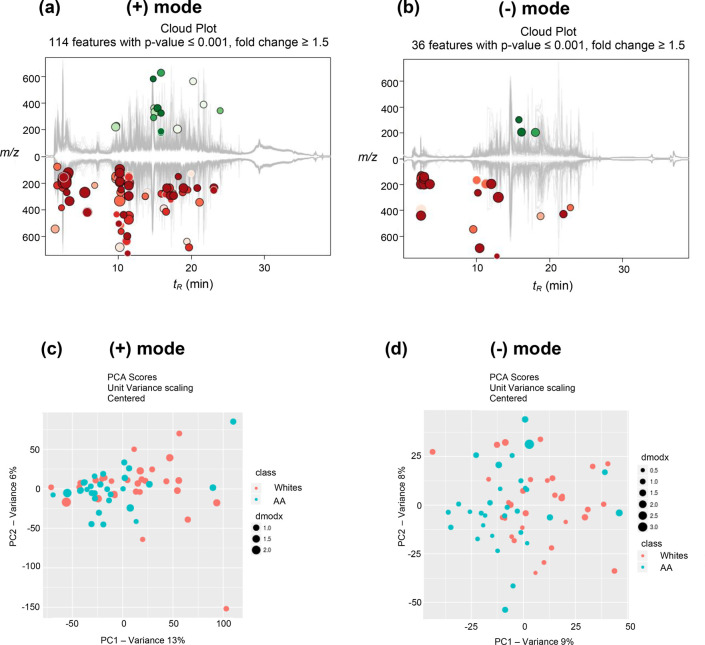
Figure 2.
Metabolic cloud plots showing significantly upregulated features (green circles) and down-regulated features (red circles) between the two groups in (a) positive mode and (b) negative mode. PCA analysis in both (c) positive mode and (d) negative mode showing modest separation between the two groups.

