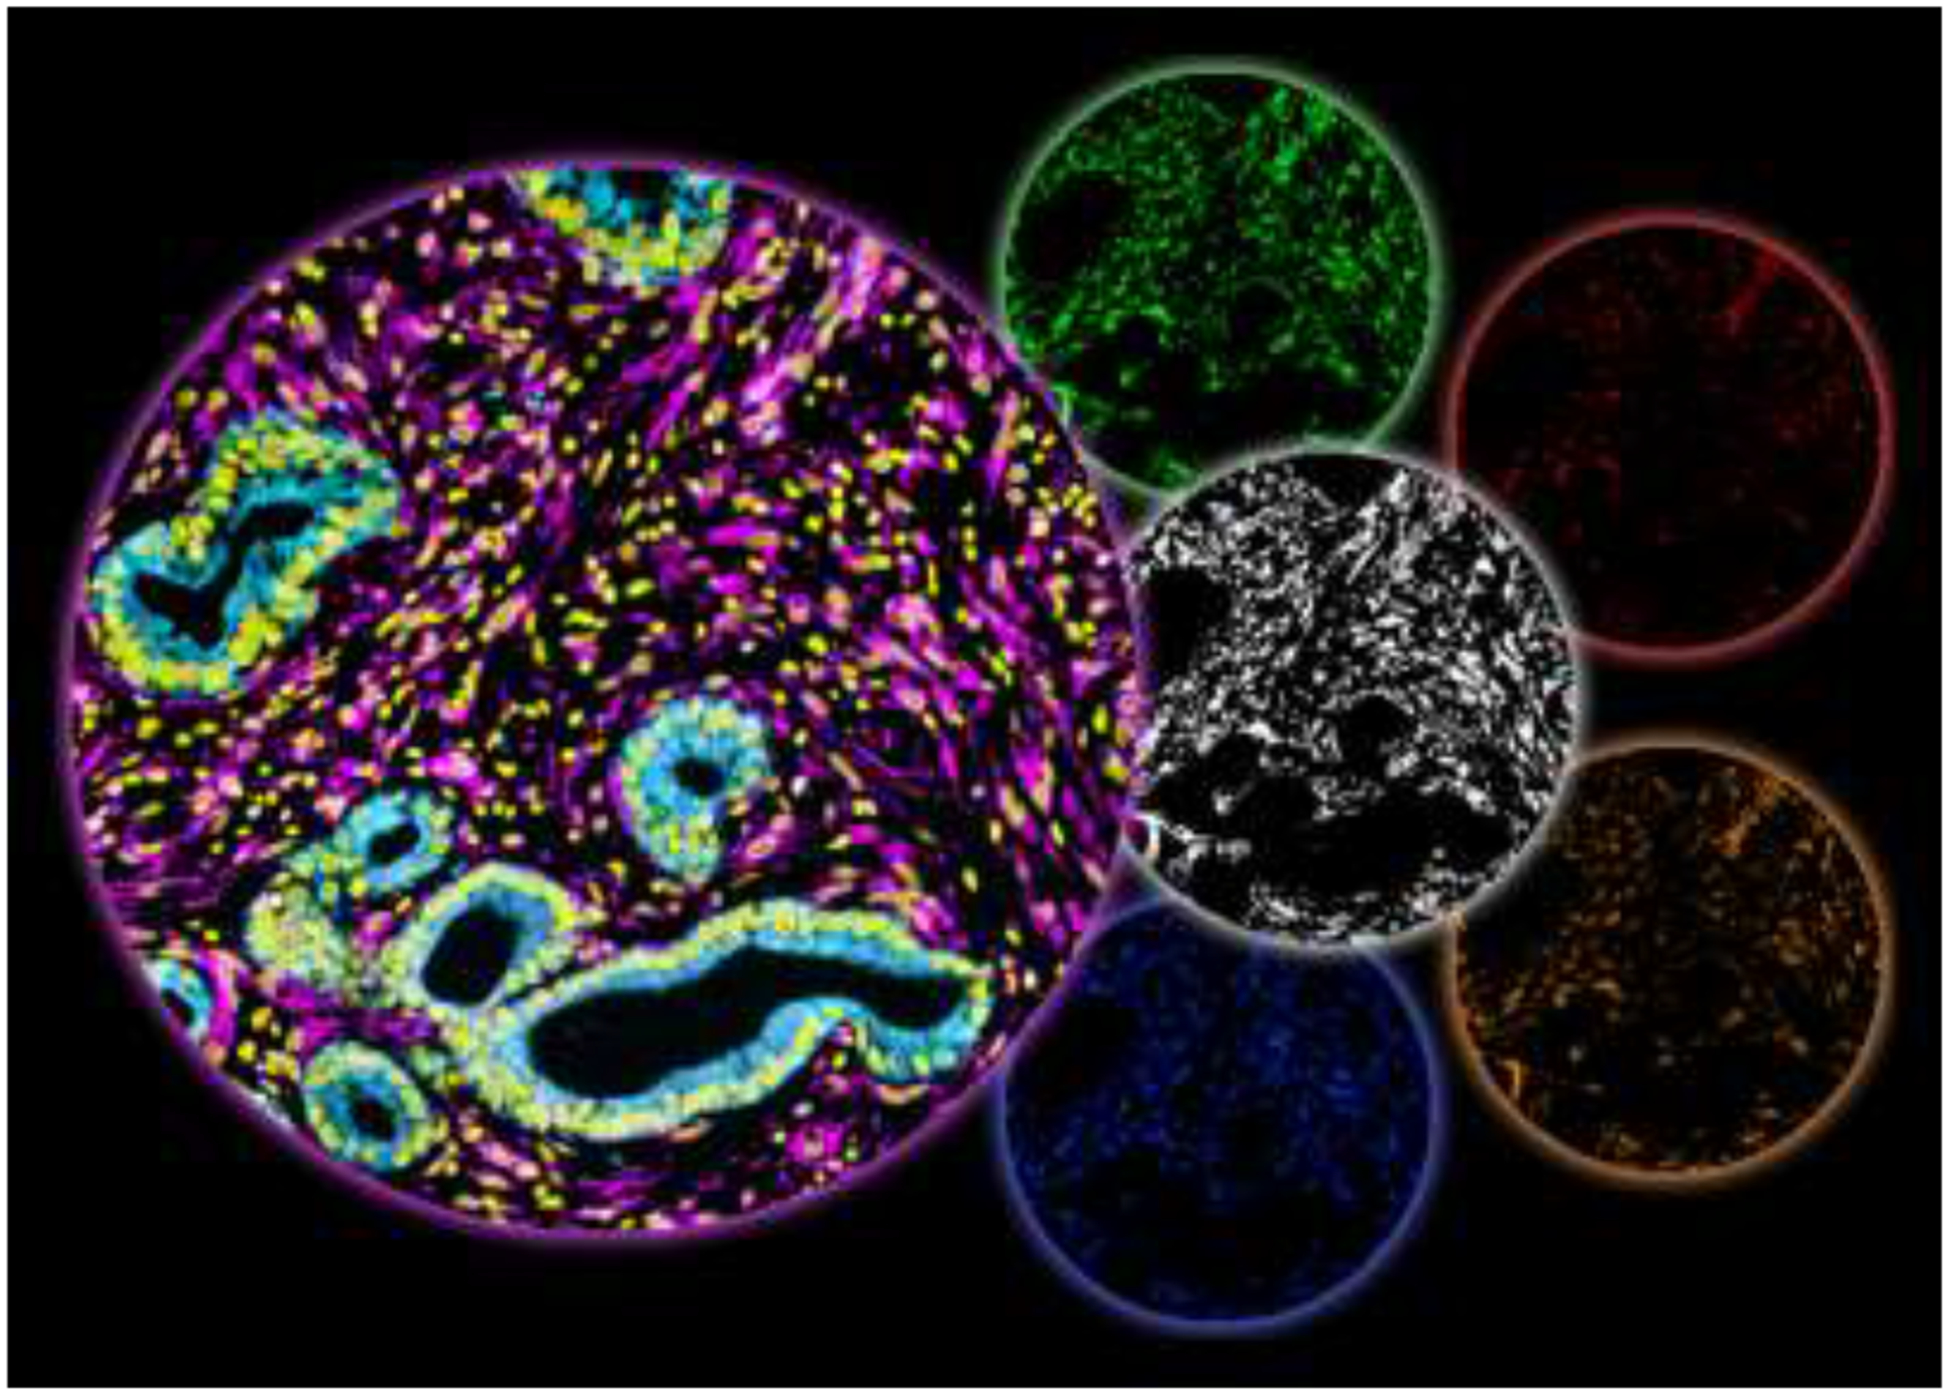
Figure 3: Human PDAC; “gating” on desmoplasia.

Simultaneous multiplex immunofluorescence of human PDAC surgical sample. The large left circle includes 3, of the 7 colors used to indicate: epithelial/tumor areas in cyan, stromal/desmoplasia areas in magenta, and cellular nuclei in yellow. The desmoplastic area, generated by the SMIA-CUKIE 2.1.0 algorithm, is shown in the white middle circle and corresponds to the magenta area. This area was used by the software to “gate” on desmoplastic/stromal positive pixels while excluding all other areas. Using desmoplastic “gating” the last 4 circles show 4 biomarkers that together depict a pro-tumoral stroma signature that is regulated by PDAC associated CAFs and ECM (figure relates to study by Franco-Barraza et. al. 2017 [84]). The 4 stromal biomarkers correspond to: the activated conformation of α5β1-integrin (green), 3D-adhesions (red) enriched in activated focal adhesion kinase (i.e., pFAK in orange), and activated SMAD (blue; indicative of canonical TGFβ1 signaling. This stromal signature was correlated with short overall survival in PDAC as well as in renal cell carcinoma patients.
