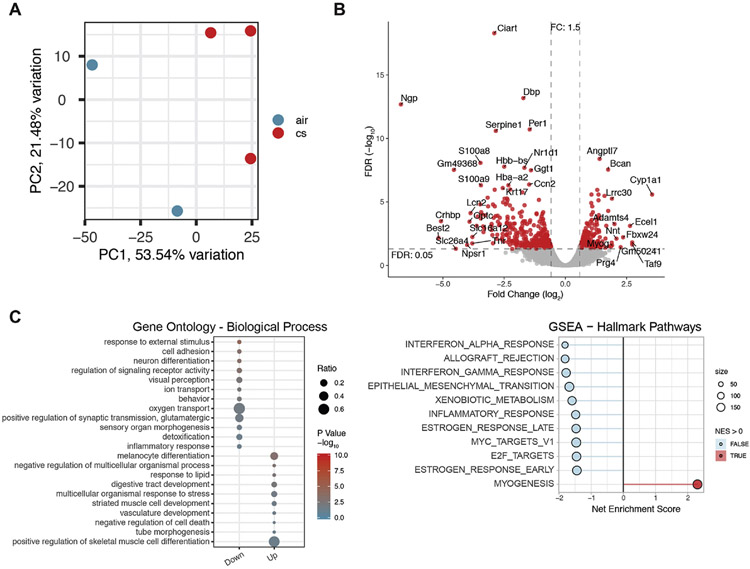
Figure 2.
Overview of differentially expressed genes. A. Principle Component Analysis for all expressed genes, totaling 15,559 genes. The samples clustered into two distinct groups of mice exposed to chronic cigarette smoking (CS) and air. B. Volcano plot of DEGs shows separation between air and CS treated mice. C. Gene Ontology enrichment of biological processes (BP) with chronic smoking exposure. Down-regulated genes from smoking are pooled in cluster1, and up-regulated genes in cluster2. The ratio of genes changed in each BP is reflected by the dot size. p-value is reflected by dot color, with red as the most confident change. D. Gene set enrichment analysis using the Hallmark Pathways. Pathways enriched in the down-regulated genes are indicated with a negative net enrichment score (light blue) and those enriched in the up-regulated genes have a positive enrichment score (red). Size indicates the number of genes in the pathway.

