
Figure 1. Changes in the Arabidopsis transcriptome during the course of vernalization.
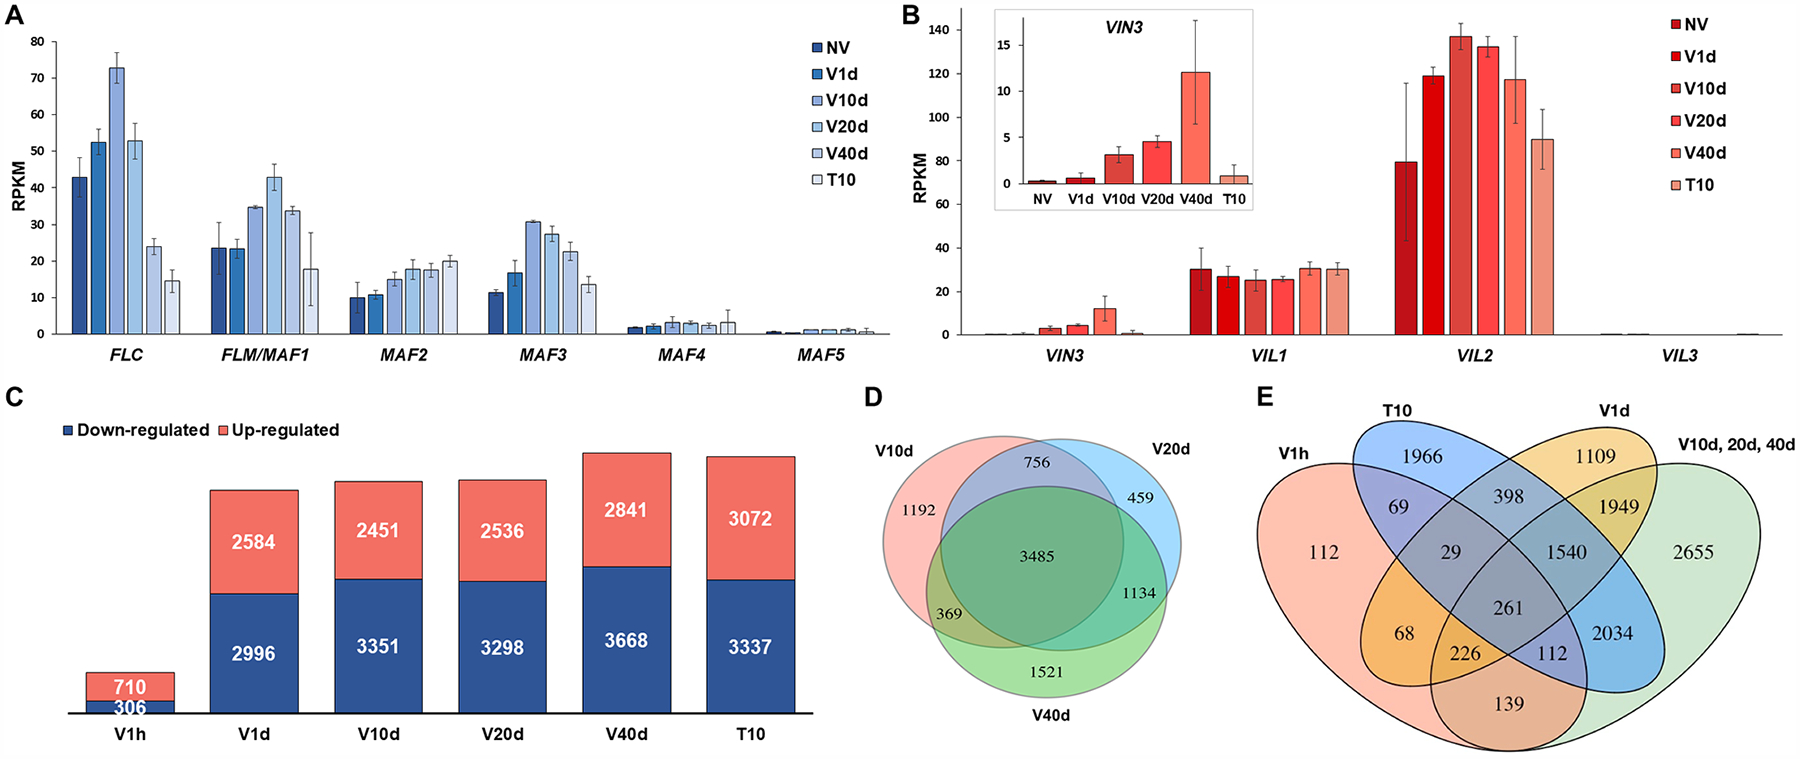
(A) Quantitative measurement of expression levels of FLC family genes over a time course during vernalization as in Reads Per Kilobase of transcript, per Million mapped reads (RPKM). Error bars were generated based on normalized read counts within each locus from 2 biological replicates. (B) Quantitative measurement of expression levels of VIN3 family genes over a time course during vernalization as in RPKM. Error bars were generated based on normalized read counts within each locus from 2 biological replicates. (C) Bar graph showing total numbers of differentially up-regulated (red) and down-regulated (blue) genes at each time point relative to NV. (D) Venn diagram showing the overlapping and uniquely differentially regulated genes at V10d, V20d, and V40d. (E) Venn diagram showing the overlapping and uniquely differentially regulated genes at V1h, V1d, V10d/20d/40d, and T10.