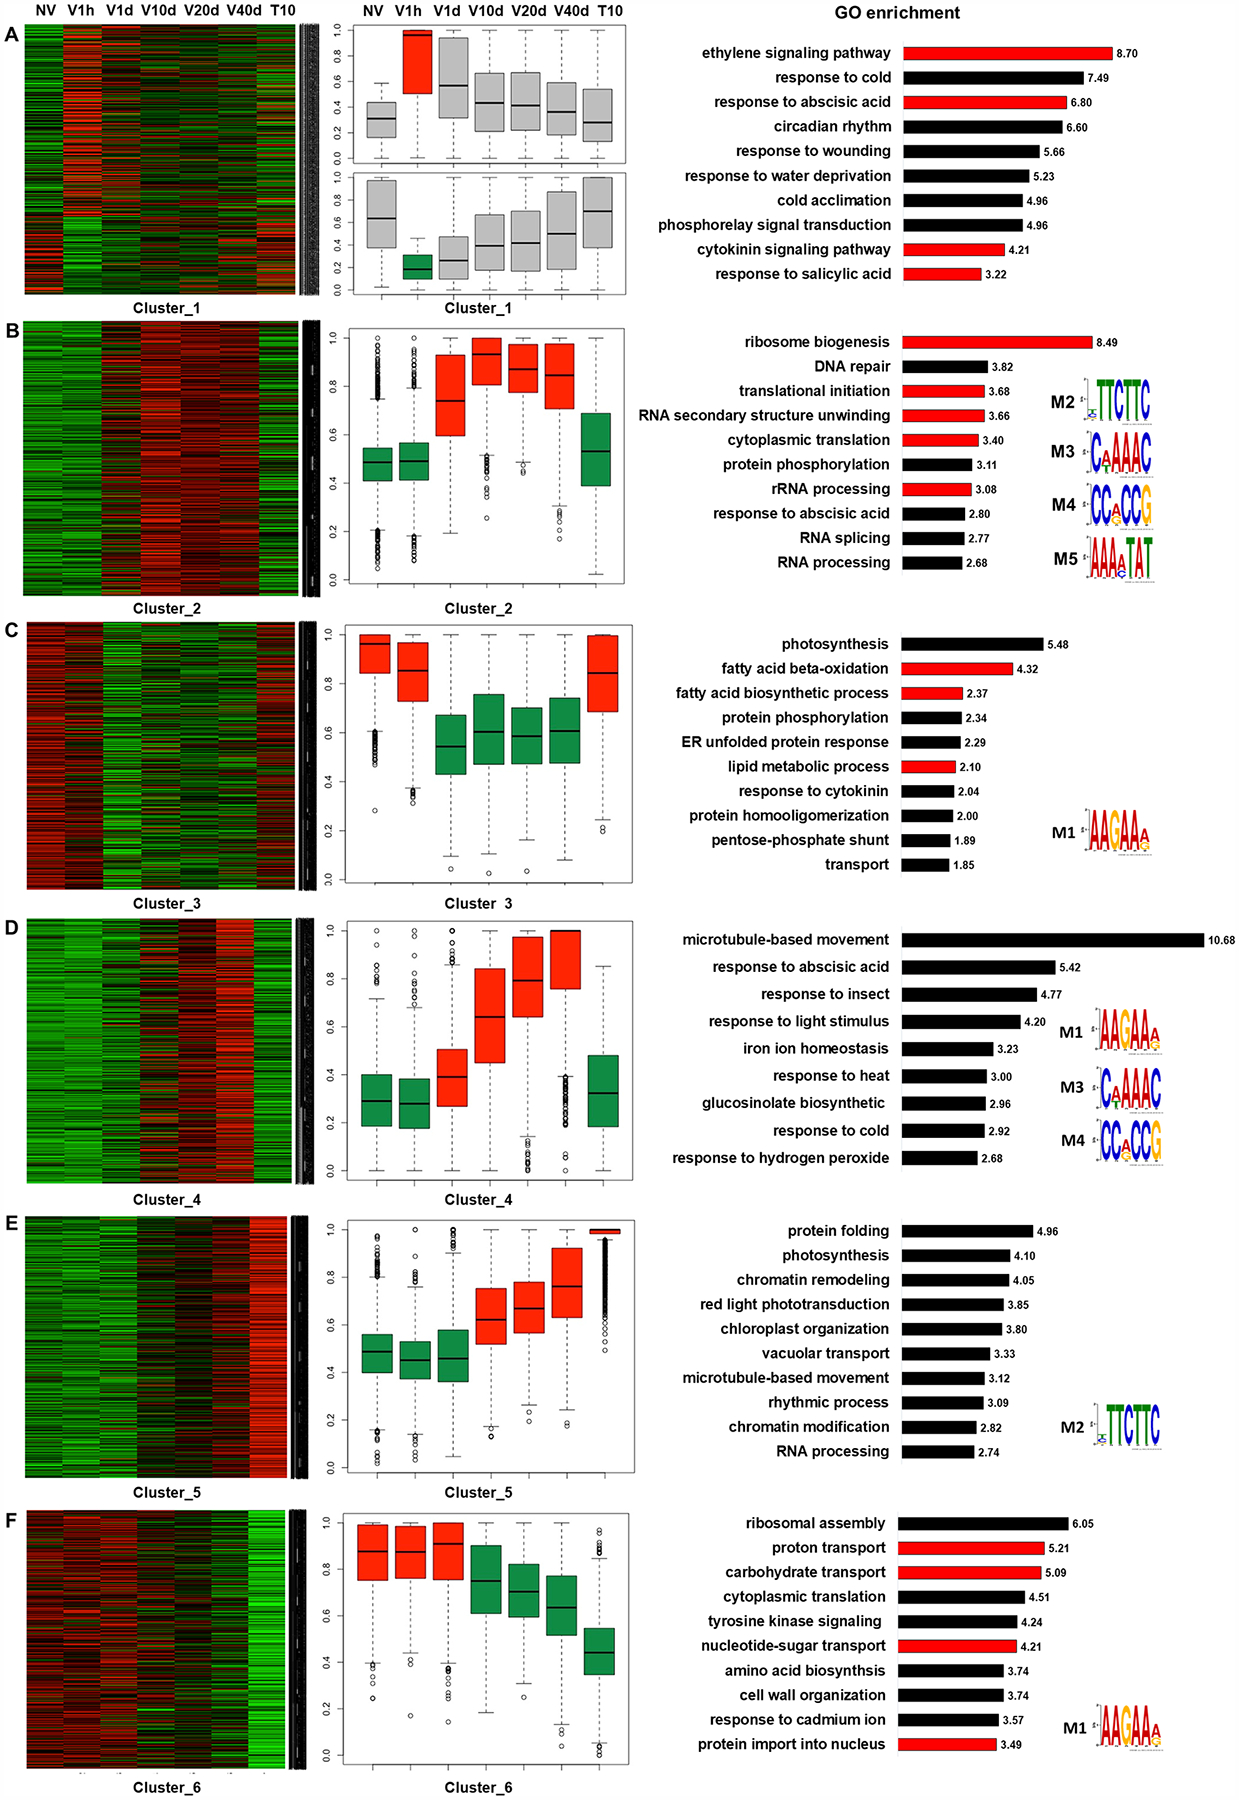
Figure 2. Clustering analysis of transcriptome data collected during vernalization.

(A-F) Clusters 1 to 6, respectively, were generated from k-means clustering of transcription profiles obtained over the time course of vernalization. Shown from left to right for genes in the indicated cluster are heatmaps of gene expression at each time point, normalized box plots of genes expression at each time point, enriched GO terms, and motifs enriched within clustered genes if detected. Grey boxes indicate no-significant difference, red boxes indicate significant up-regulation, and green boxes indicate significant down-regulation in normalized box plots of genes expression.
