
Figure 3. Genome-wide analysis of histone modifications during the course of vernalization.
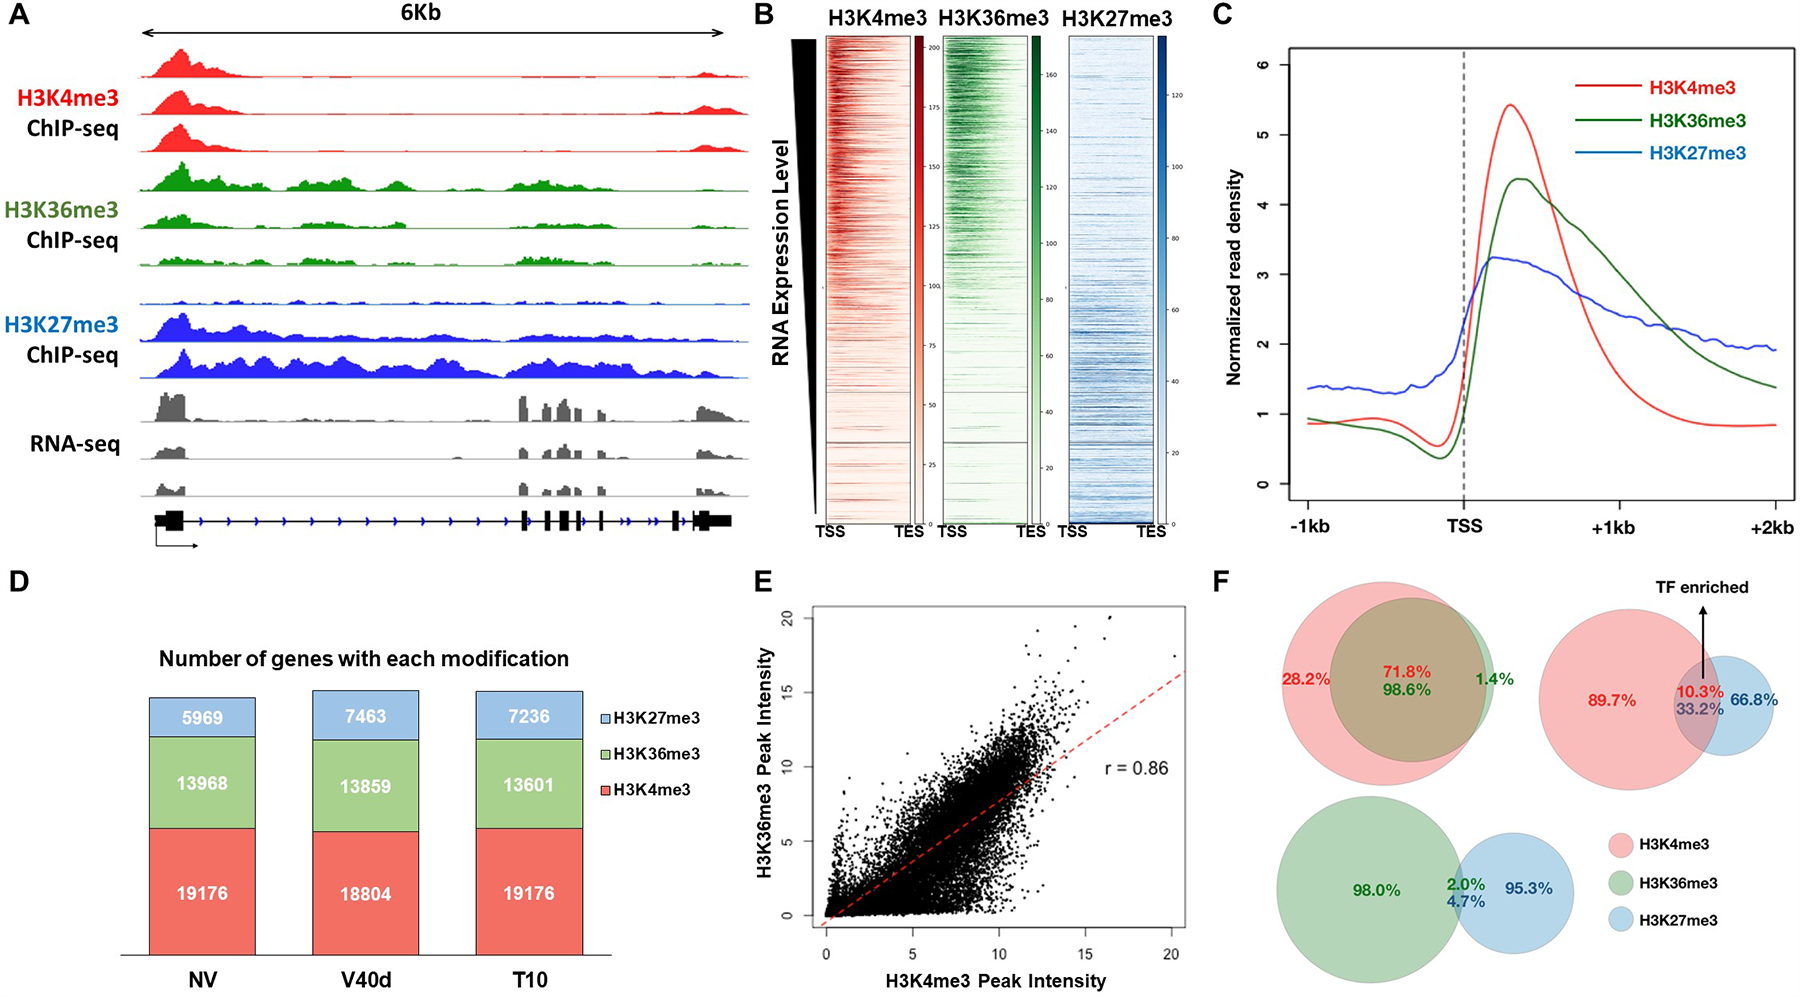
(A) Genome browser illustration of normalized ChIP-seq and RNA-seq results at FLC locus. H3K4me3 tracks are shown in red, H3K36me3 in green, and H3K27me3 in blue. RNA-seq results are shown in grey colors. (B) Heatmaps of H3K4me3 (red), H3K36me3 (green), and H3K27me3 (blue) over all coding genes in Arabidopsis genome. Each row represents the normalized read density from transcription start site (TSS) to transcription end site (TES) of each gene, ranked by transcription level from the highest (top) to the lowest (bottom). (C) Averaged profiles of H3K4me3 (red), H3K36me3 (green), and H3K27me3 (blue) distributions around TSS regions over all coding genes in Arabidopsis genome. (D) Bar graph showing total number of peaks called by MACS2 within each sample. (E) Correlation plot of genome-wide H3K4me3 and H3K36me3 densities. (F) Venn diagrams showing overlapped among different histone marks from all three time points.