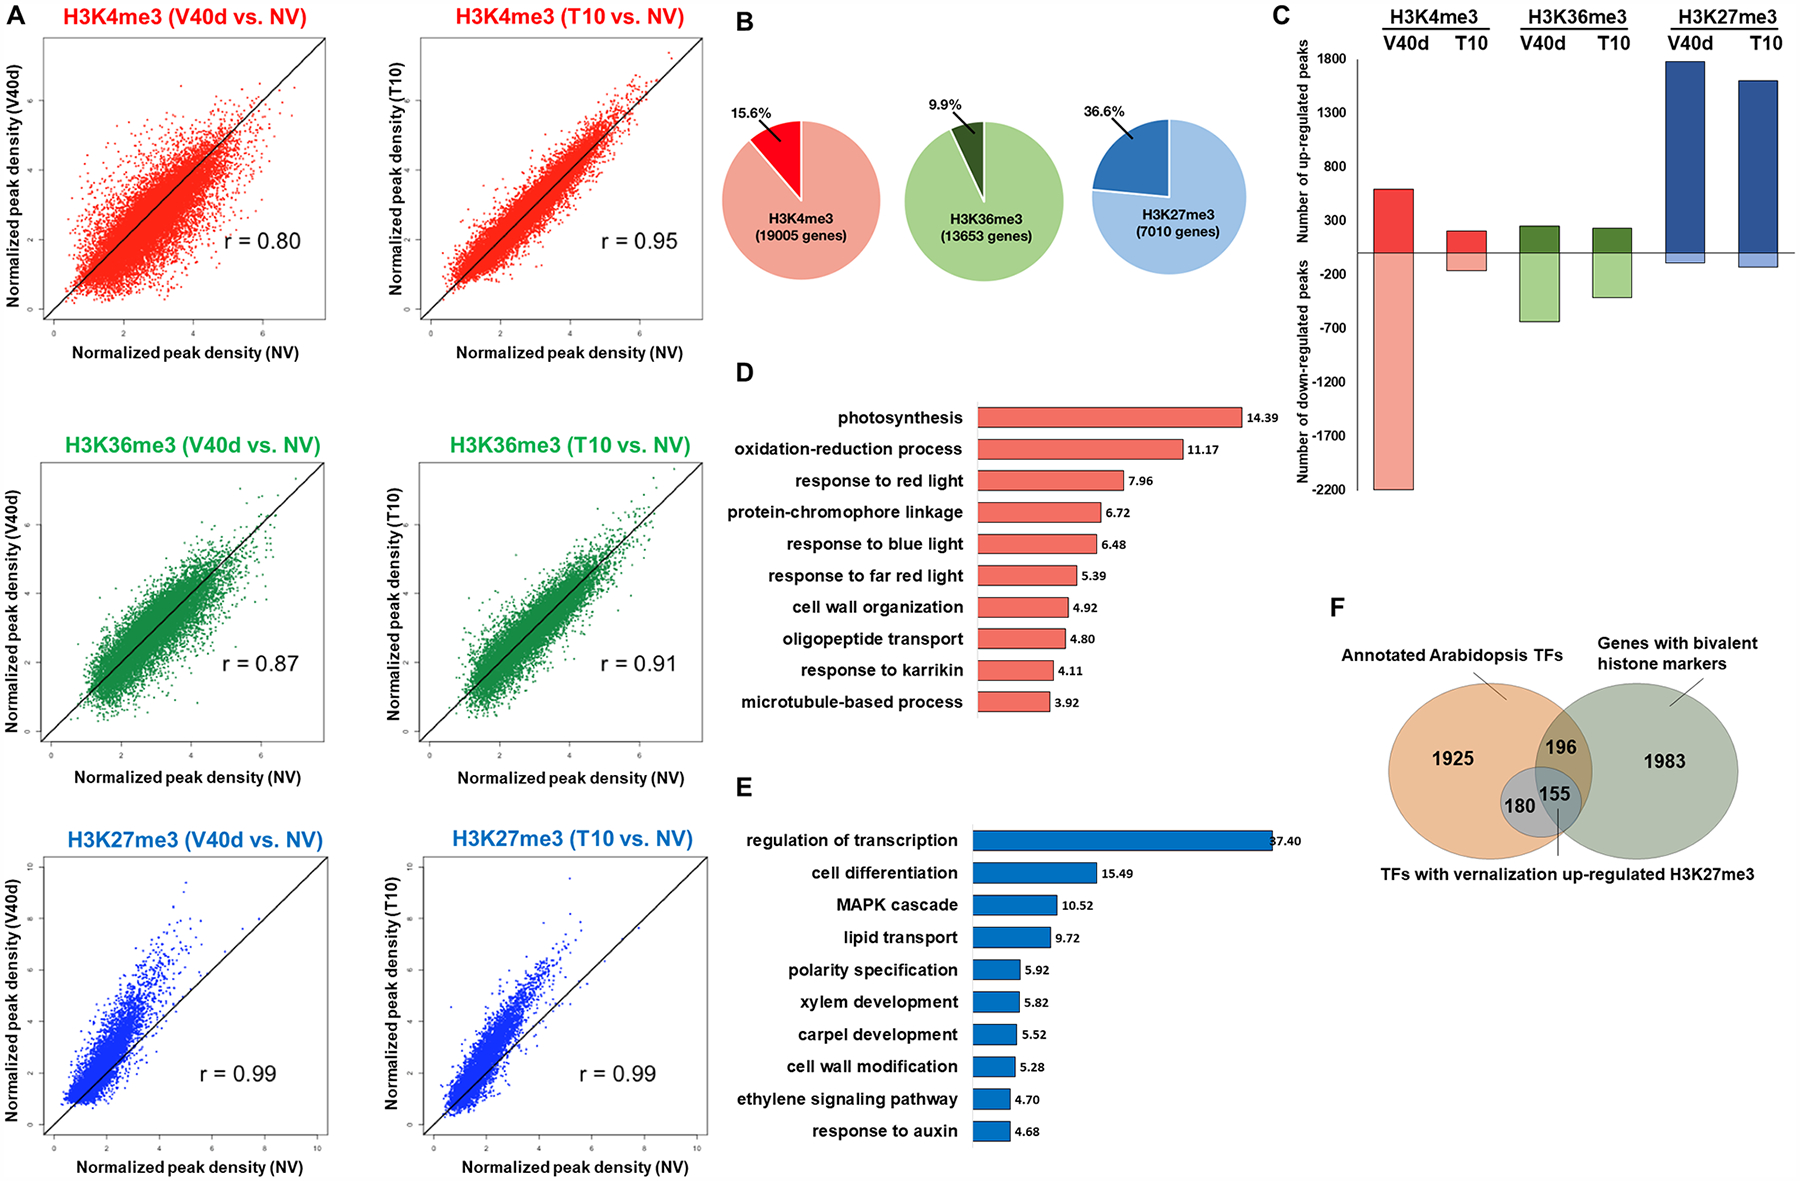
Figure 4. Characteristics of histone modification-enriched loci during the course of vernalization.

(A) Correlation plots of densities of H3K4me3 in red, H3K36me3 in green, and H3K27me3 in blue in V40d vs. NV (left) and T10 vs. NV (right) samples. (B) Pie graph showing the percentages of histone modification peaks differentially regulated during vernalization. (C) Bar graph showing the number of vernalization up-regulated (darker hues) and down-regulated (lighter hues) H3K4me3 (red), H3K36me3 (green), and H3K27me3 (blue) peaks. (D) Bar graph showing top GO terms ranked by enrichment score from H3K4me3 temporarily down-regulated loci with p-value. (E) Bar graph showing top GO terms ranked by enrichment score from H3K27me3 up-regulated loci with p-value. (F) Venn diagrams showing overlaps among all annotated transcription factors (TFs), genes with bivalent histone marks, and TFs with increased H3K27me3 by vernalization.
