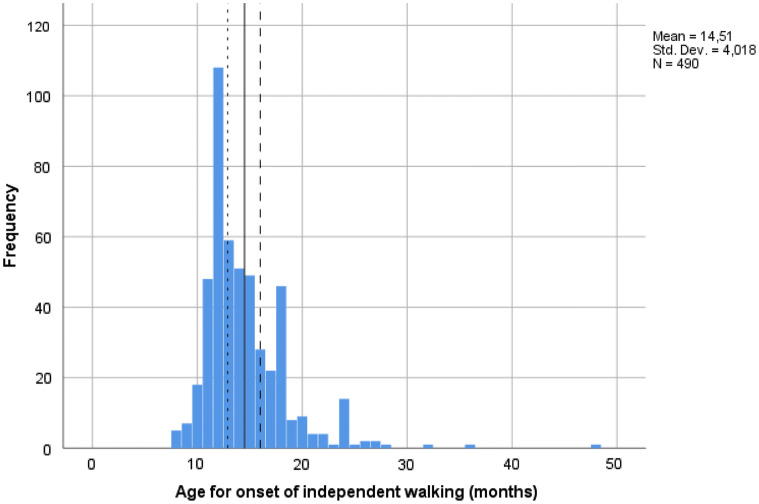
Fig. 2.
Distribution of age for onset of independent walking (AOW) in the total study sample (N = 490). Small and larger stippled lines represent mean AOW among Norwegian children (Storvold et al. 2013) and cutoff for “late walking” (≥ 16 months), respectively; solid line represents mean AOW in the present sample

