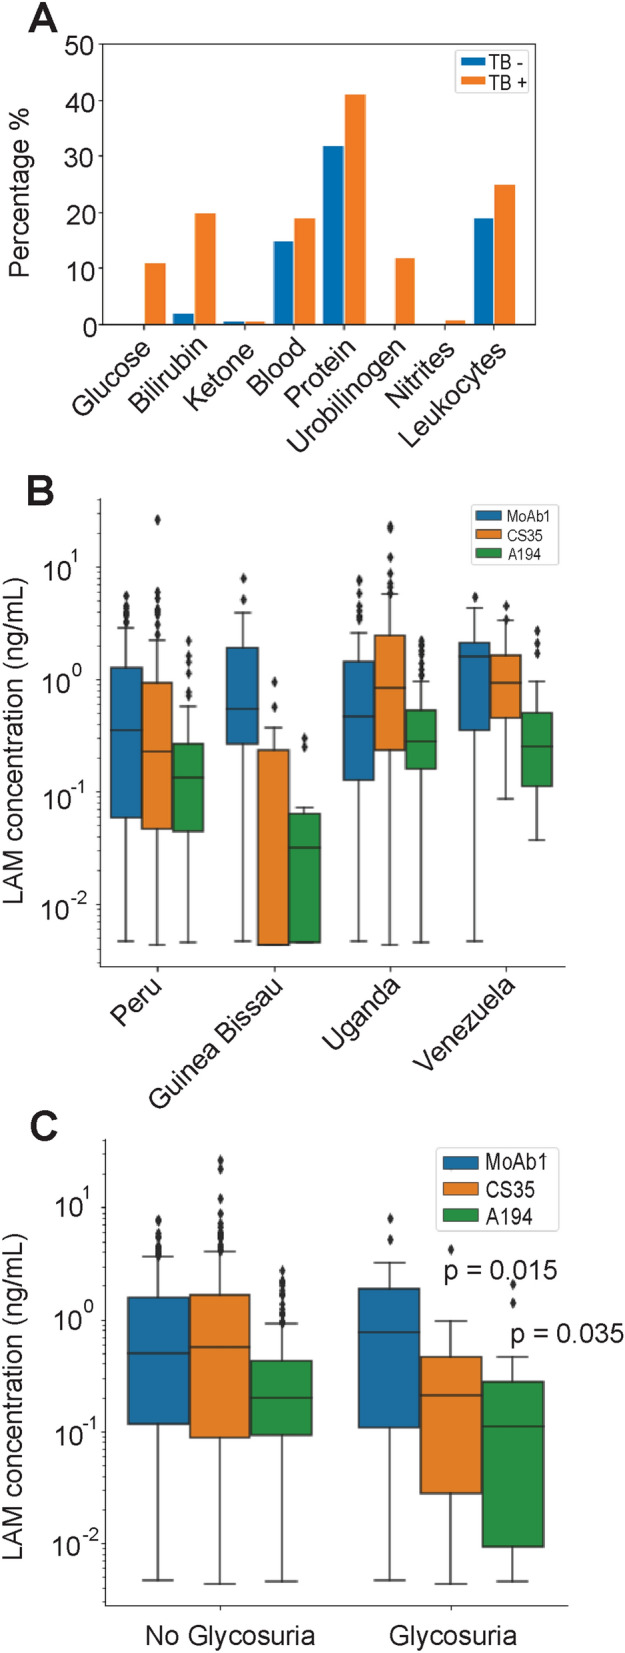
Figure 3.

Urinalysis and geographical diversity influence LAM values. (A) Abnormal urine values were noted in both controls and TB positive patients. (B) Median urinary LAM concentration varies across different geographic areas (independent sample median test p = 0.030, pairwise comparison in Supplementary Figure S4). Assuming no collection and storage bias, this might be caused by different levels of disease severity at diagnosis, since access to healthcare might be delayed to a greater degree in certain countries. (C) Urinary LAM values were lower in TB patients with glycosuria (n = 22) when measured using CS-35 (p = 0.015) and A194 (p = 0.035).
