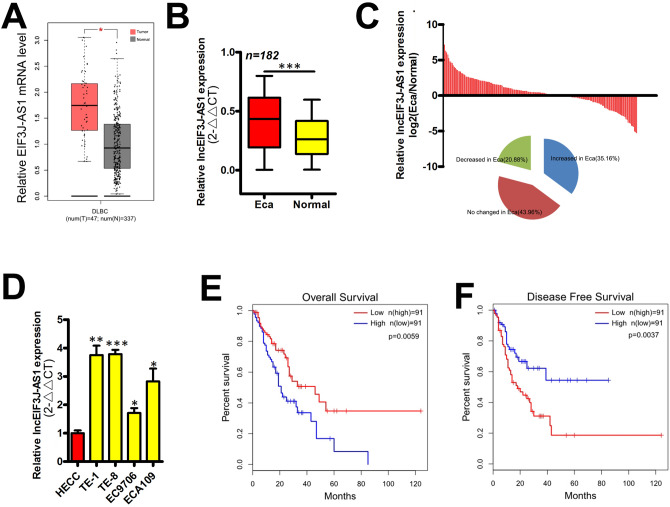
Figure 1.
EIF3J-AS1 levels are increased in ECa. (A) Expression of EIF3J-AS1 in ECa and paired normal tissue samples from the GEPIA data. (B) Expression of EIF3J-AS1 was measured in ECa and paired normal tissue samples via qRT-PCR. (C) Histogram and pie chart of the proportions of Eca samples in which EIF3J-AS1 expression was up-regulated (64/182, 35.16%, blue), down-regulated (38/182, 20.88%, green), or no change (80/182, 43.96%, red). Log2 (T/N) expression value > 1 as higher expression, which < − 1 as lower expression, and between − 1 and 1 as no significant change. (D) Expression of EIF3J-AS1 was measured in ECa and control cell lines. (E, F) Overall survival (OS) and Disease-free survival (DFS) in ECa patients. Kaplan Meier (KM) curves were plotted for survival analysis. p-value *< 0.05; **< 0.01; ***< 0.001.

