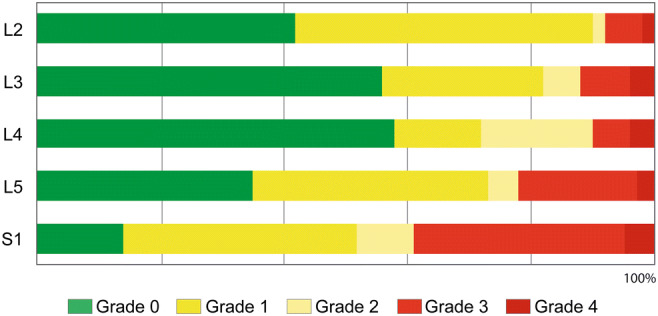
Fig. 2.

The bar chart shows the proportional mean frequency of the grades (0–4) within a certain nerve root (rostro-caudally aligned), averaged over the complete sample. Thus, differences involving the rostro-caudal distribution of grades are illustrated. The color code is explained at the bottom and corresponds to the grading categories (Fig. 1). A comparison of grade 3 and grade 4 prevalence (marked in two shades of red) shows that higher-graded rootlets were more noticeable at lower nerve root levels (L5, S1). The rootlets which showed inconspicuous grade 0 response, marked in green, were more frequent in L3 and L4. The color marking is almost identical for grade 1 and grade 2 (marked in two shades of yellow) since radicular overlap often makes it difficult to determine whether it is the corresponding muscle groups that are responding to stimulation or an adjacent group [36, 43].
