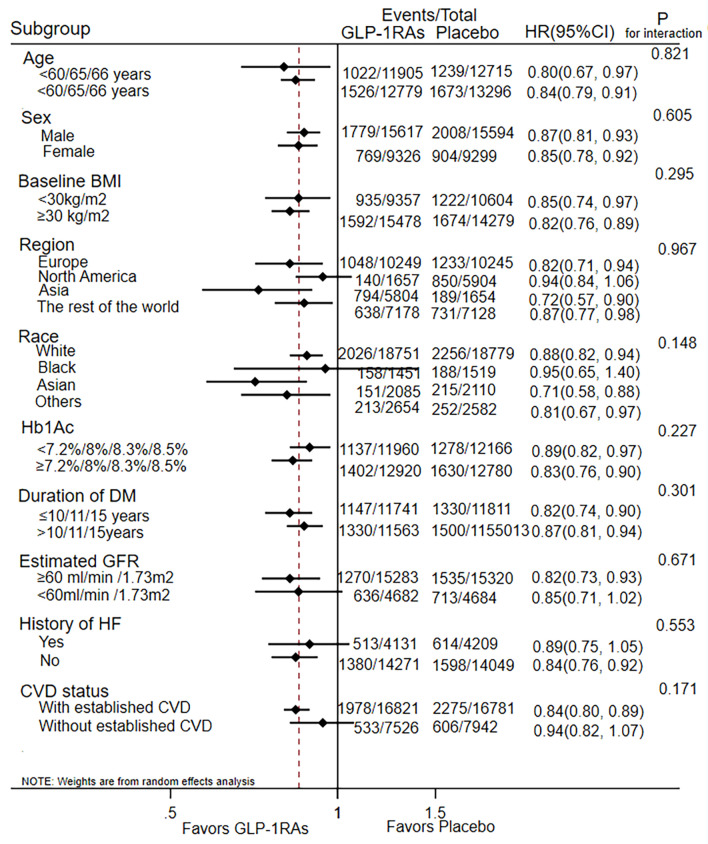
Fig. 2.
Forest plot of subgroup analyses. P for interaction: the P value for differences within subgroups. Age < 60/65/66 years: the stratifications for age were done using the cutoff of 60 years or 65 years or 66 years in different trials. LEADER, 60 years; REWIND, 66 years; other trials, 65 years. HbA1c < 7.2%/8%/8.3%/8.5%: the stratifications for HbA1c were done using the cutoff of 7.2% or 8% or 8.3% or 8.5% in different trials. LEADER, HbA1c 8.3%; SUSTAIN-6 and PIONEER-6, HbA1c 8.5%; EXSCEL and Harmony Outcomes, HbA1c 8%; REWIND, HbA1c 7.2%. HR hazard ratio, CI confidence interval, GLP-1RAs glucagon-like peptide 1 receptor agonists, DM diabetes mellitus, GFR glomerular filtration rate, GFR glomerular filtration rate, HF heart failure, CVD cardiovascular disease

