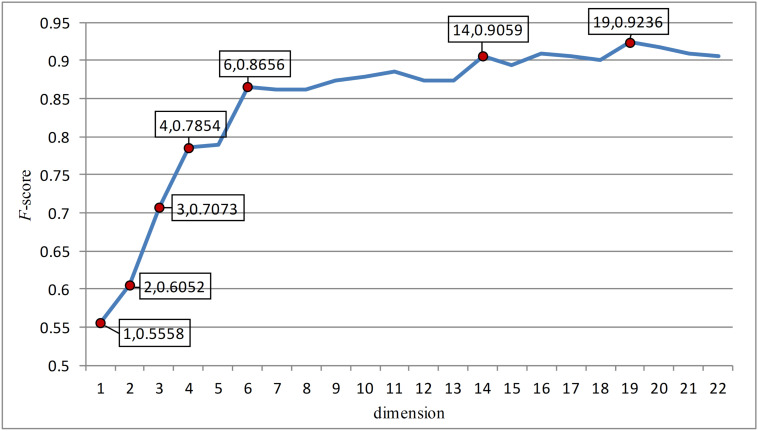
FIGURE 3.
The figure was the change of F-score with dimension according to the last dimension reduction. The red dots in the figure were the feature points with great changes in this paper. And these points were separated to form a new feature model and verified. After verification, these seven red dots are the most important seven features.

