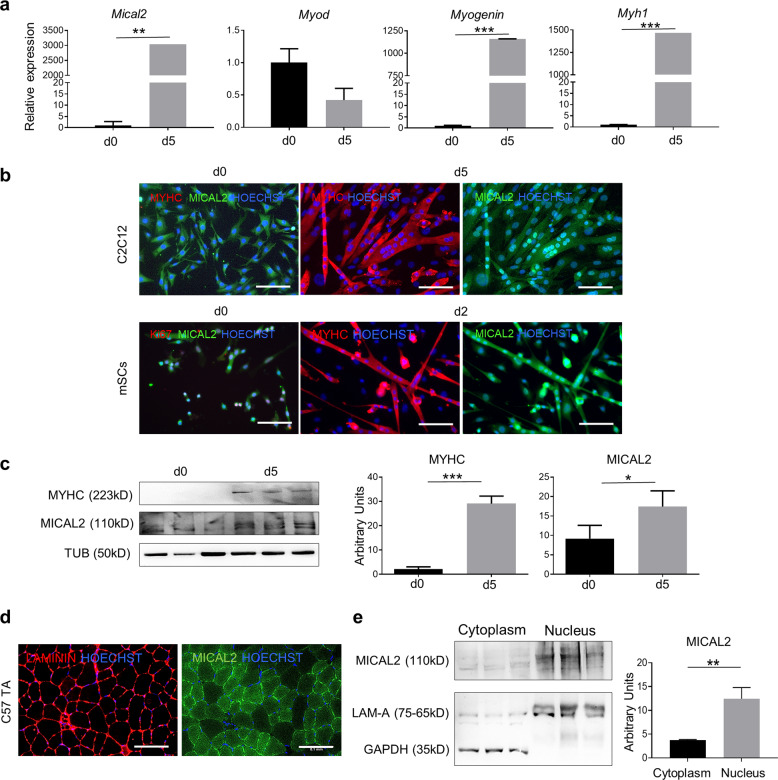
Fig. 1. MICAL2 increases in C2C12 and mSCs differentiated myotubes.
a qRT-PCR showing the relative expression of MyoD, Myogenin, MyH1 and Mical2 at day0 and day5 of C2C12 cell differentiation. b IF assay for MyHC (red) and MICAL2 (green) at day 0 and day 5 (C2C12) or day 2 (mSC) of skeletal muscle differentiation. Nuclei stained with HOECHST (blue). Scale bars 200 μm. c WB for MyHC and MICAL2 proteins on proliferating (day 0) and differentiating (day 5) C2C12 cells. The relative quantification is on the right. d IF analysis for MICAL2 (green) and LAMININ (red) localization on TA cross-sections of C57/Bl6 (C57). Scale bars 100 μm. N = 3. e WB for MICAL2 cytoplasmic and nuclear protein fractions on C57/Bl6 (C57) GN. The relative quantification is on the right. * = p < 0.05; ** = p < 0.01; *** = p < 0.001 by two-tailed t test. See also Figs. S1–S3.

