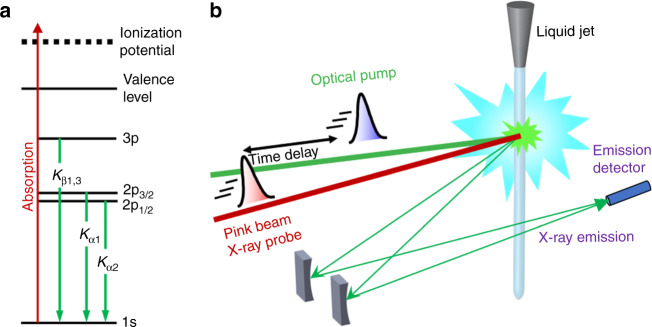
Fig. 2. Experimental scheme.
a Energy level diagram showing the origin of the Kα and Kβ fluorescence after creation of a hole in the 1s (K) shell. The Kα1 and Kα2 lines originate from the splitting of the 2p orbital (2p1/2 and 2p3/2), whereas for Kβ these lines are degenerate, resulting in the line labelled Kβ1,3. b Experimental setup for the time-resolved X-ray emission spectroscopy measurements at the XFEL. The green line represents the optical (533 nm) pump pulse used to excite the sample and the red line represents the X-ray (centred at 8.168 keV) probe pulse at varying time delays (black arrow). The pulses are overlapped and intercept the sample at the green interaction region. A von Hamos geometry was used for these measurements.

