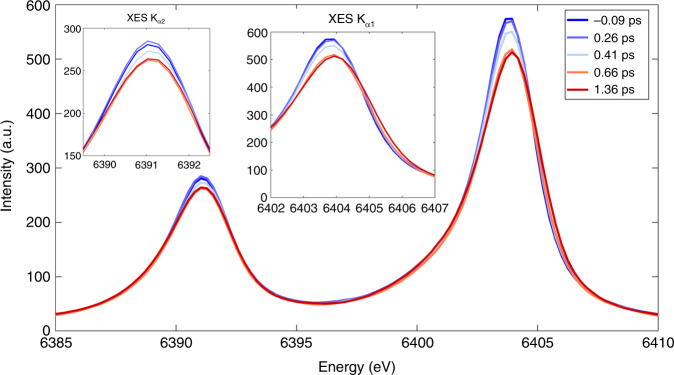
Fig. 4. Kα XES spectra of MbNO at various time delays after visible photoexcitation.
Laser-on (−0.09 ps) and laser-om XES spectra of MbNO at different time delays between 0.26 and 1.36 ps (from blue to red) showing an intensity decrease for Kα2 over the first 1.2 ps after excitation and an intensity decrease and change in peak width for Kα1. Also, the visibility of changes in peak width (σ) smaller than the energy resolution (~0.6 eV) can be well observed. The insets zoom into the peaks of the Kα2 and Kα1 laser-on (pumped) XES spectra of MbNO at different time delays between −0.09 and 1.36 ps (from blue to red) showing an intensity decrease for Kα2 over the first 1.2 ps after excitation and an intensity decrease and change in peak width for Kα1. The changes in peak width (σ) smaller than the energy resolution (~0.6 eV) can be well observed.

