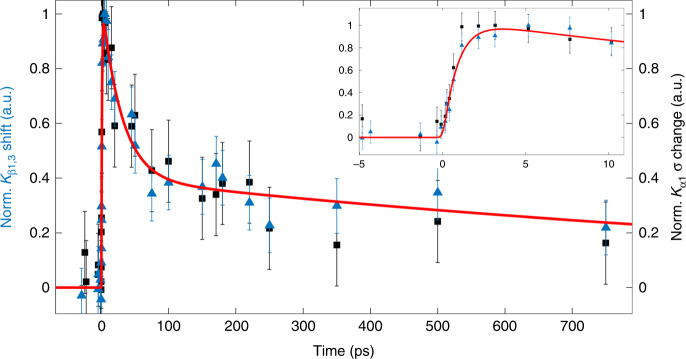
Fig. 5. Kinetic traces.
Temporal evolution of the relative shift for MbNO (blue triangles, centroid obtained from Gaussian fit, max shift is ~0.45 eV, see Supplementary Note 6) and of the peak width changes for MbNO (black squares, normalized σ obtained from a Gaussian fit, maximum change in σ is ~0.3). The red line is a fit of the experimental data using a function consisting of a rising component and a biexponential decay. The former corresponds to a risetime of 800 ± 150 fs (see Supplementary Note 6 and Supplementary Fig. 18), significantly longer than our cross-correlation (~150 fs), while the decay components have time constants (pre-exponential factors) of τ1 = 30 ± 9 ps (A1 = 0.6) and τ2 = 1.5 ± 0.9 ns (A2 = 0.4). The inset shows the temporal evolution during the first 10 ps of both signals. The error bars represent the 1-sigma uncertainty of the Gaussian fit for the spectra at each time-point. Details are given in Supplementary Note 6 and Supplementary Fig. 18.

