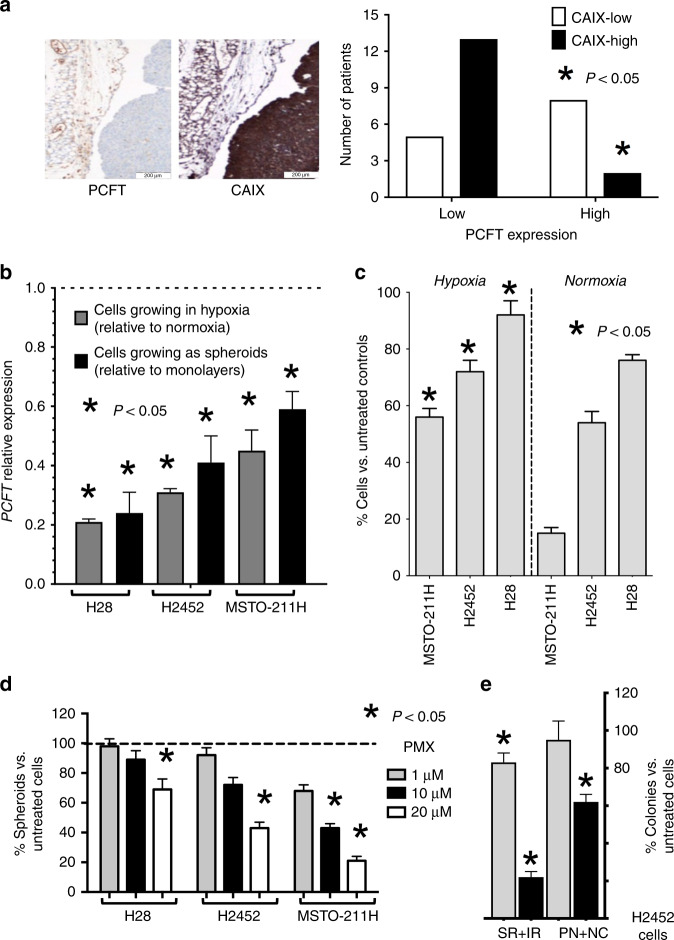
Fig. 1. Hypoxia affects PCFT expression and pemetrexed activity.
a Left panel: representative immunohistochemical pictures of two consecutive sections of an MPM tissue stained with anti-PCFT and anti-CAIX antibodies (left and right pictures, respectively, original magnification ×20). Right panel: analysis of the inverse/negative correlation of PCFT and CAIX staining in MPM patients (N = 28). b Quantitative RT-PCR analysis of PCFT mRNA expression in human MPM cell lines growing under hypoxic conditions or as spheroids. For each mesothelioma cell line, the results are presented relative to the expression levels of PCFT in cells growing in normoxia as two-dimensional monolayer cell cultures, assigned a value of 1 (dashed line). Columns, mean values obtained from three independent experiments; bars, SEM. *Significantly different (P < 0.05) compared with the untreated cells under normoxic conditions. c Cell growth inhibition performed with cells exposed to 1 µM pemetrexed (PMX) for 72 h under hypoxic vs. normoxic conditions, as compared with drug-free control cells. Columns, mean values obtained from three independent experiments; bars, SEM. *Significantly different (P < 0.05) compared with the same treatments under normoxic conditions. d Relative number of spheroids originating from H2452 cells treated with PMX compared with spheroids originating from drug-free cells, assigned a value of 100%. Columns, mean values obtained from three independent experiments; bars, SEM. *Significantly different (P < 0.05) compared with spheroids growing from untreated cells. e Relative number of colonies originated from the perinecrotic region and necrotic core (PN + NC) compared with the surface and intermediate regions (SR + IR) of H2452 spheroids treated with 1 or 10 µM PMX for 72 h, compared with spheroids originating from untreated cells, assigned as a value of 100%. Columns, mean values obtained from three independent experiments; bars, SEM. *Significantly different (P < 0.05) compared with untreated cells.

