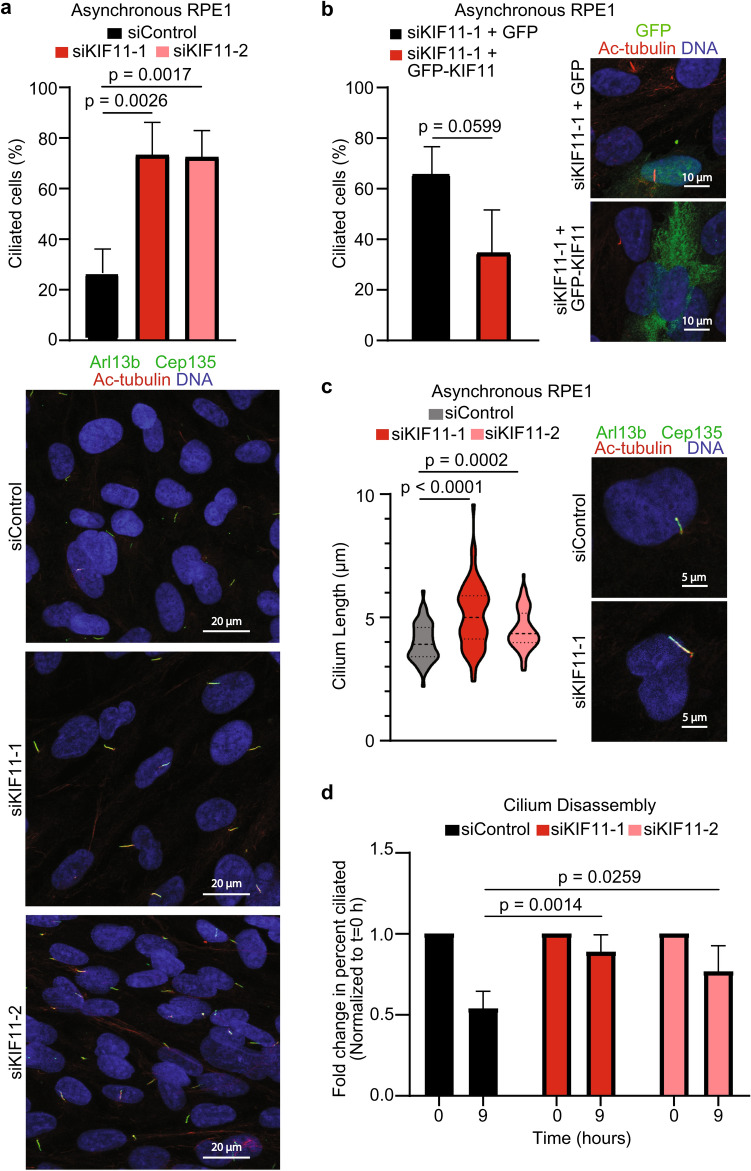
Figure 3.
Depleting KIF11 leads to alterations in cilia dynamics and length. (a) Asynchronous RPE1 cells were treated with either siControl, siKIF11-1, or siKIF11-2. After 72 h, cells were fixed and probed with α-Arl13b (green), α-Cep135 (green), α-KIF11 (red), and the DNA was counter-stained with Hoechst (blue). Percentage of ciliated cells was calculated for each condition and graphed (n = 3 biological replicates with 150–250 cells counted per n). Data analyzed by Student’s t-test. Error bars represent standard deviation. Representative images for each condition are shown in the image panels. (b) Asynchronous RPE1 cells were treated with siKIF11-1, and after 24 h were then subsequently transfected with GFP, or GFP-KIF11. 48 h later cells were fixed and probed with α-Arl13b (red), α-Cep135 (red), α-GFP (green), and the DNA was counter-stained with Hoechst (blue). Percentage of ciliated, GFP-positive cells was calculated from the total number of GFP positive cells for each condition, and results were graphed (n = 3 biological replicates with 50–100 cells counted per n). Data analyzed by Student’s t-test. Error bars represent standard deviation. Representative images for each condition are shown in the image panels. (c) Cilium length was measured for each condition and graphed (n = 3 biological replicates with 20–30 cells counted per n). Data analyzed using a Student’s t-test. Error bars represent standard deviation. Median and quartiles denoted by dashed lines within violin plots. Representative images for each condition are shown in the image panels. (d) To evaluate disassembly of primary cilia, asynchronous RPE1 cells were treated with either siControl, siKIF11-1, or siKIF11-2. After 24 h, cells were serum starved. 24 h later cells from each condition were collected, and serum was added back to the remaining cells. Cells were collected 9 h later. All cells were fixed and probed with α-Arl13b, α-Cep135, α-KIF11, and the DNA was counter-stained with Hoechst. Percentage of ciliated cells was calculated for each condition and graphed (n = 3 biological replicates with 125–250 cells counted per n). Data analyzed by 2-way ANOVA with Sidak’s post-test. Error bars represent standard deviation.

